Higher Degree is the monthly macro read around the Nasdaq: U.S. equities, international, the dollar, gold, real estate, and bonds, each placed in its own wave structure and tied into one narrative. It maps the environment the weekly Nasdaq read has to trade inside.
Six markets, one story.
Week of Oct 30 · by Paul Johnson. Each of these six markets moves in its own wave structure, and each one tells you something about the others: the dollar as the swing factor for gold and international, bonds and real estate sharing the same rate-cycle exposure, and the Nasdaq sitting at the center of it all. The current read across all six lives in the Synthesis section below.
Analysis as of 2026-10-30
Price as of 2026-10-30
The wave count Neutral
S&P 500 · the Nasdaq's broad-market benchmark.
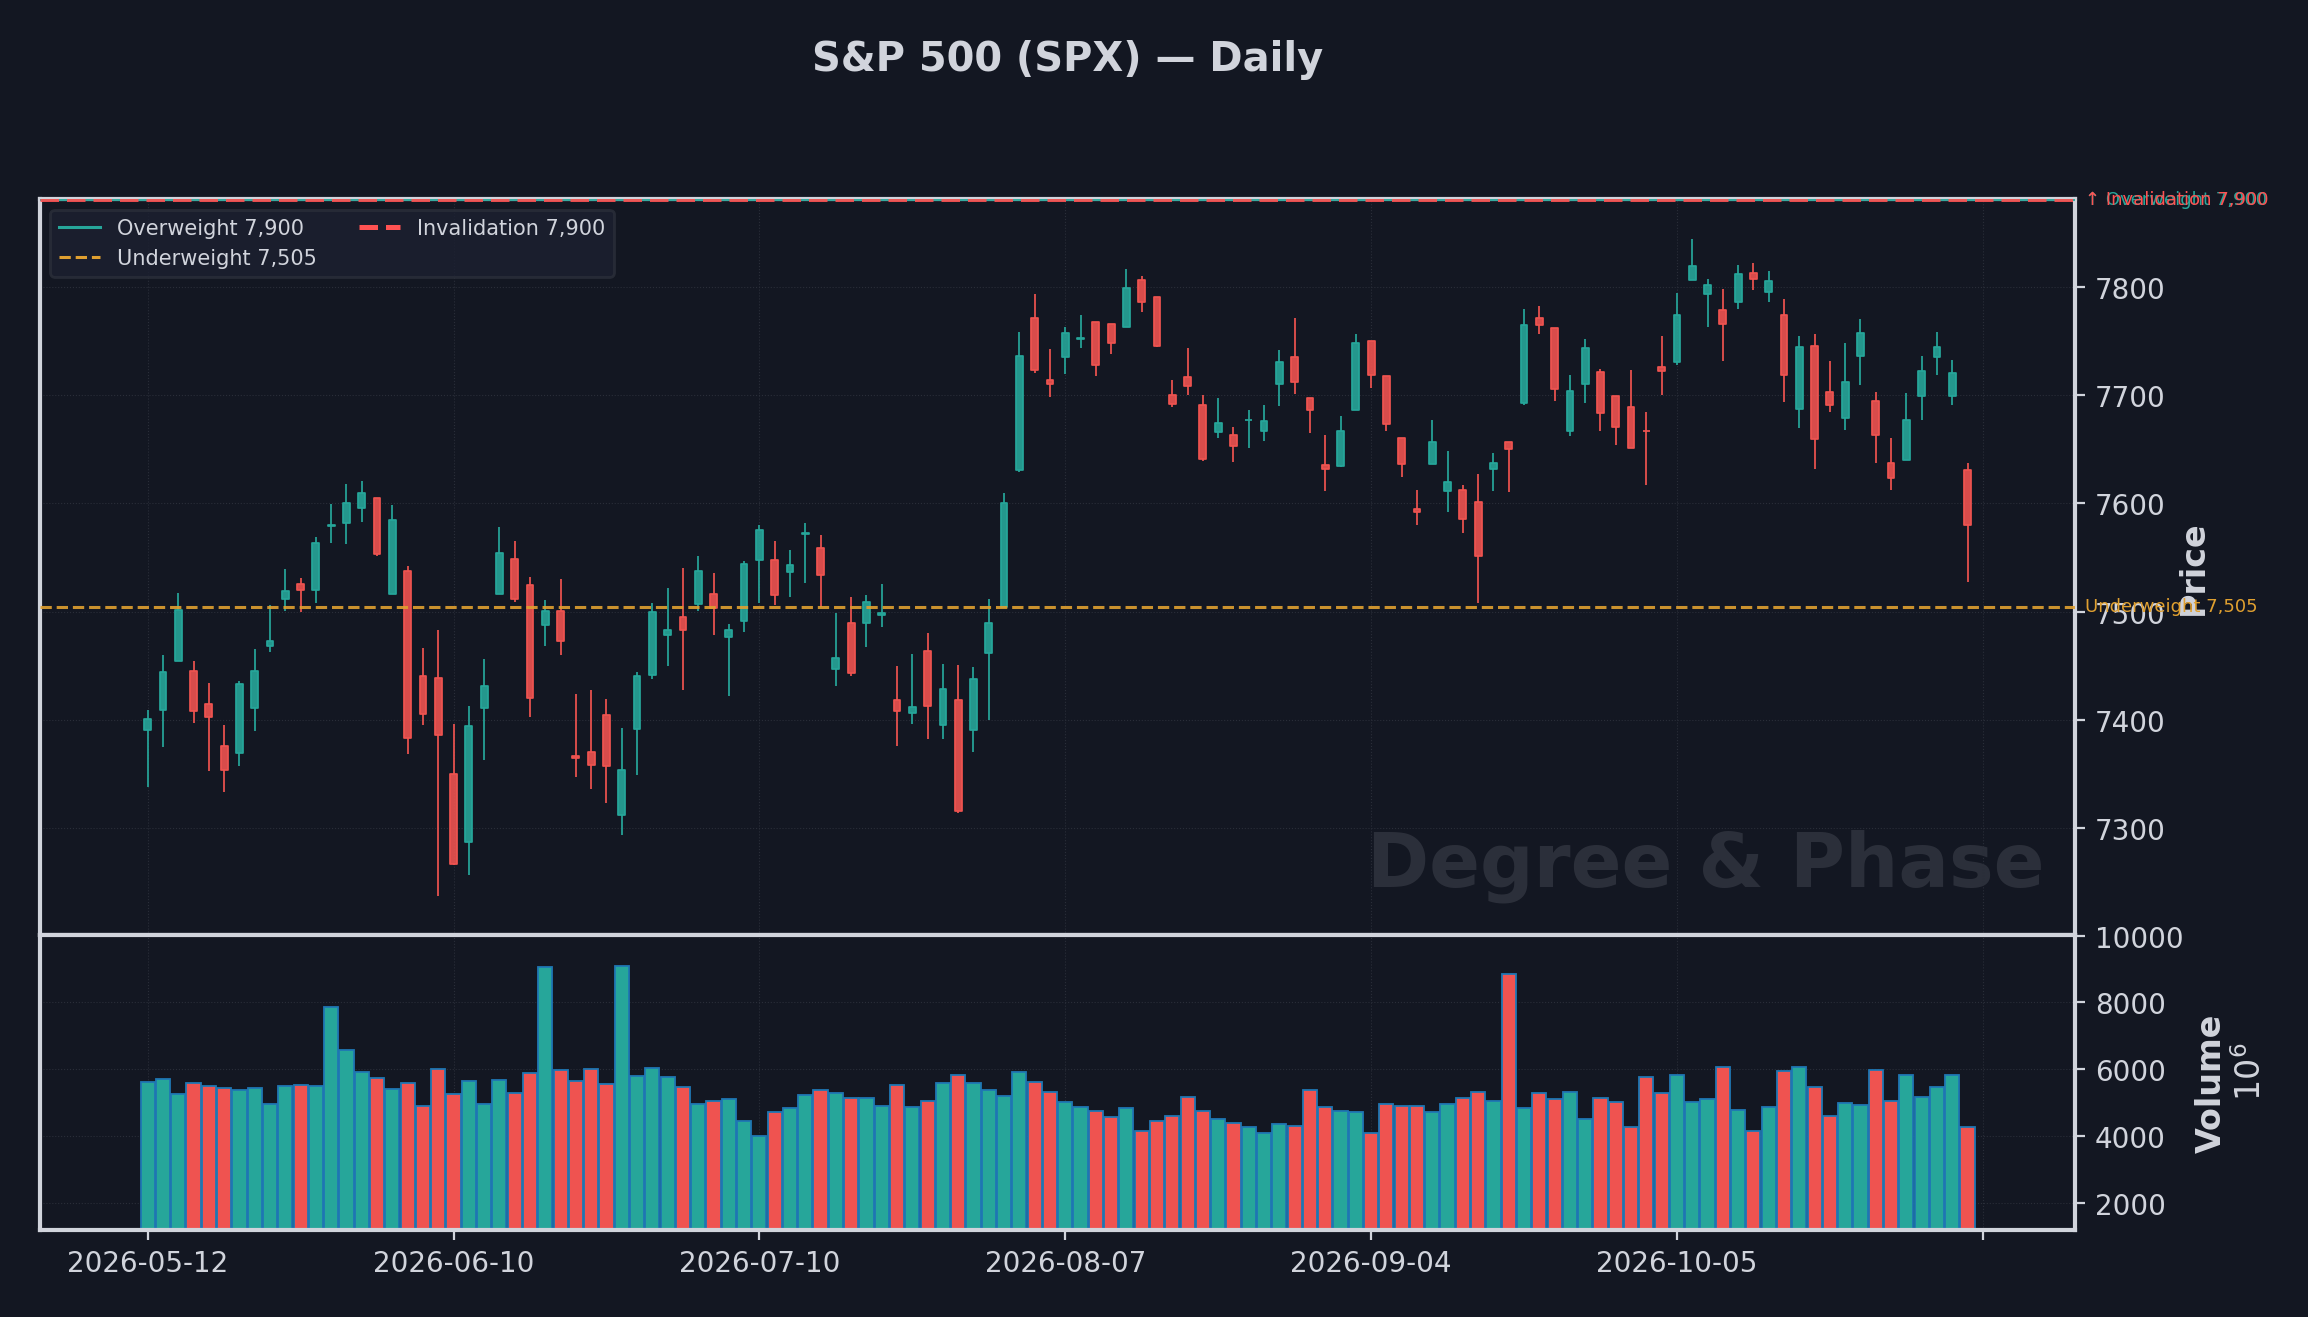
From the 2022 low (3,491.58) to the all-time high, the advance traces a rule-legal extended fifth wave, among the most exhaustion-prone structures a bull market can produce. A structure like that argues for caution without dictating an outcome on its own. We hold benchmark weight and let price decide: a new high above the fifth wave's peak keeps the benefit of the doubt with the bulls; a break below the fourth wave's low hands the edge to the top-is-in case. See the live levels below, and the current read in the Synthesis section.
| Level | Price | Means |
|---|---|---|
| Engage correction | 7,504.78 | The correction is on |
| Top case in doubt | 7,844.52 | A close back above it weakens the top count |
| Top-case dies (new high) | 7,900 | The fifth just extended; back to benchmark |
The base breakout Bullish
EFA · international developed-market equities.
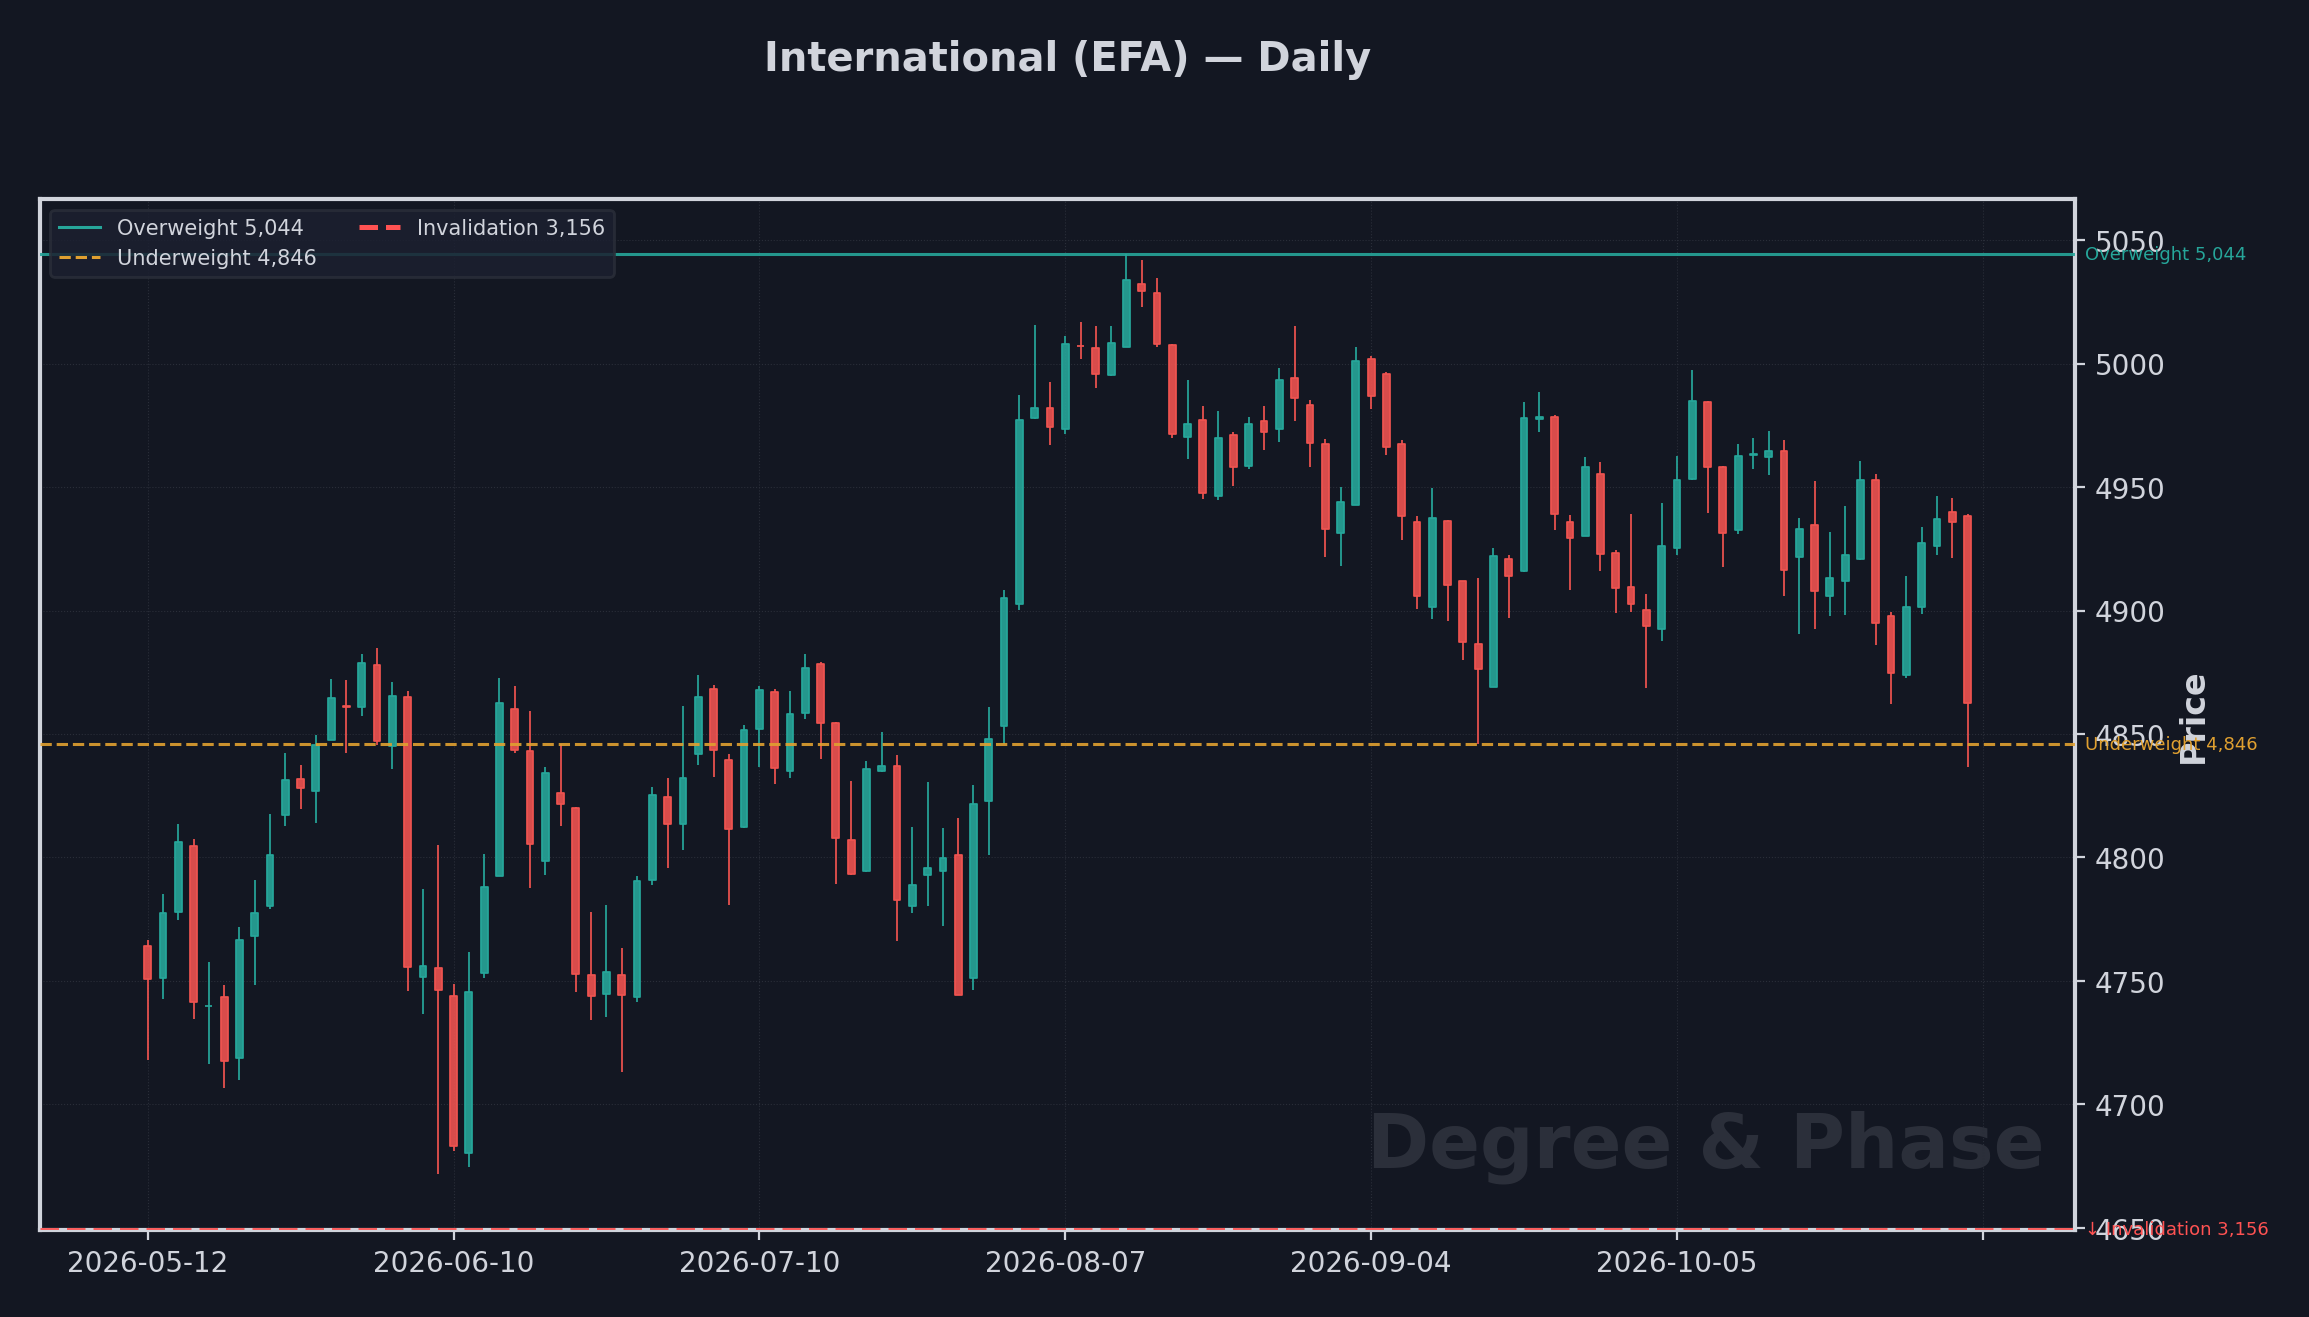
An 18-year base breakout: EFA cleared its 2007 ceiling (86.5) in May 2025, built on a clean five-wave advance off the 2022 low. A fifth wave that runs out to its 1.618 extension is a textbook spot for that leg to end, the same exhaustion signature the Nasdaq's own fifth carries. The dollar is this sleeve's main external driver: a falling DXY is a tailwind, and a DXY reclaim of its own breakdown level would press this sleeve almost as hard as it presses gold. See the live levels below, and the current read in the Synthesis section.
| Level | Price | Means |
|---|---|---|
| Breakout extends (new high) | 5,044.2 | The advance runs further |
| Fifth topped | 4,846.0 | The cleanest bull just topped |
| Buy zone | 4,400 | Add on the pullback, not the extension |
Read it first Neutral
DXY · the dollar index, the pivot for gold and international.
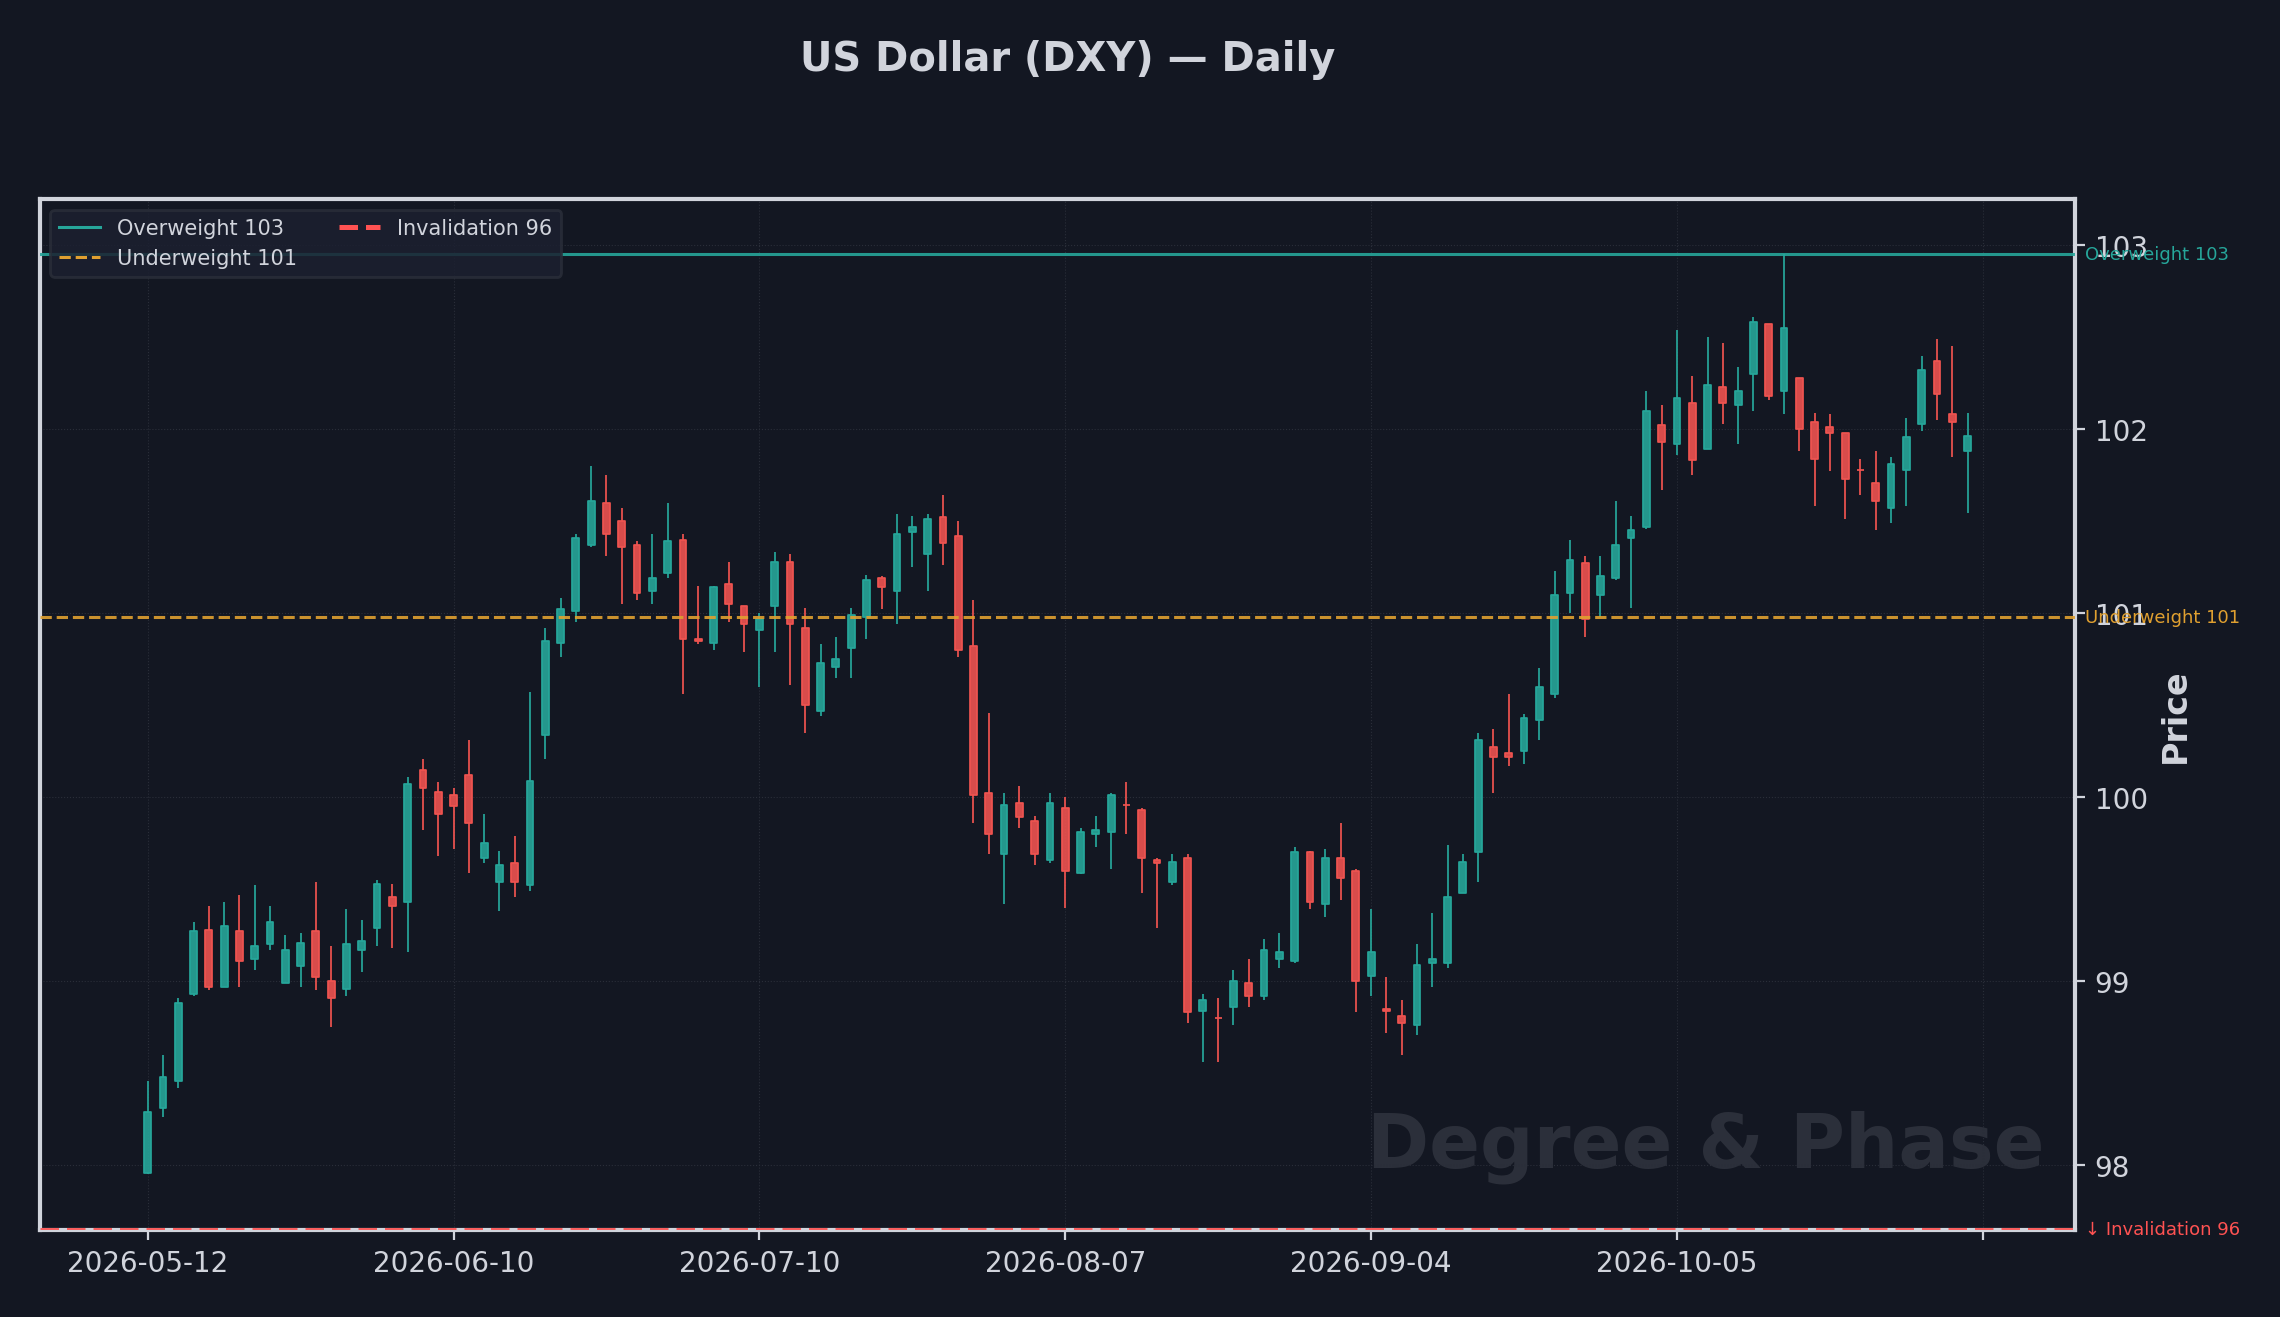
Structurally a Supercycle-degree zigzag down from the 1985 high (164.72), with the leg off the 2022 high to the January-2026 low (95.55) forming a completed A-B-C. The reclaim level in the table below is the fork for the whole board: hold under it and the dollar-down trade for gold and international keeps working; close above it and both of those sleeves take the hit at once. See the live levels below, and the current read in the Synthesis section.
| Level | Price | Means |
|---|---|---|
| Decline resumes | 100.98 | Rotation into gold/international accelerates |
| Low is in / bases | 102.95 | The September hike landed; that rotation stalls |
| Downside | 87.5–89.2 | The next shelf, then the low-80s over years |
The secular bull Bearish
Gold · the dollar's inverse, and a macro-fear gauge.
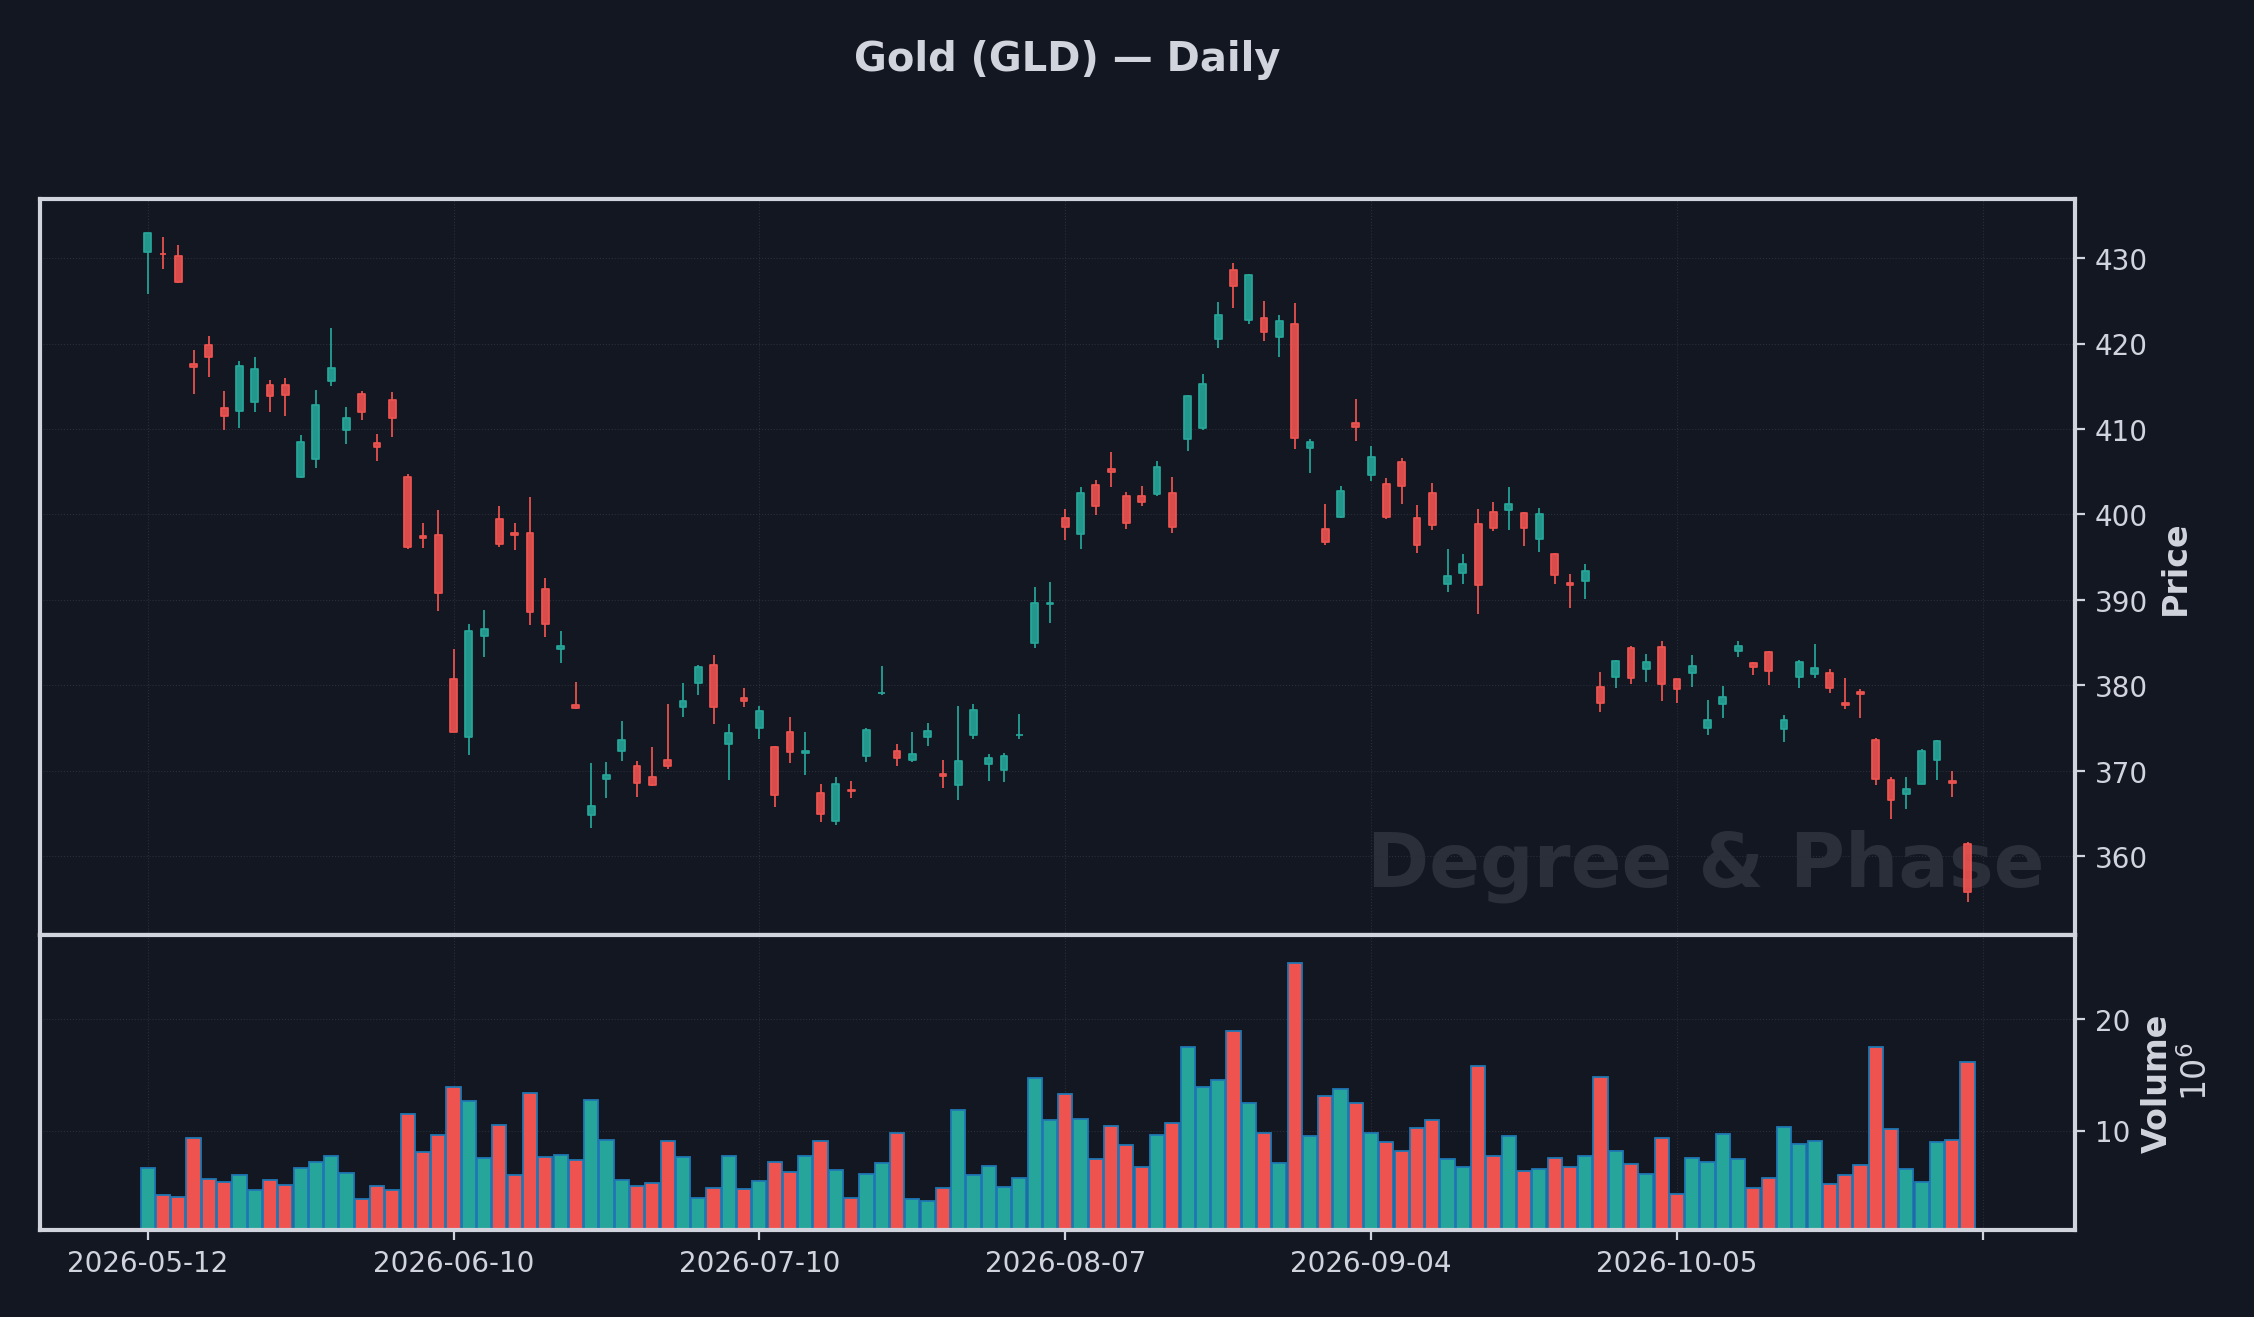
A secular bull since the 2001 low (255), interrupted by a near-vertical spike to 5,586 in January 2026 that reversed 13.6% intraday in a single session, among the sharpest blow-off reversals in the whole move. The dollar is the same external driver here as for international: a falling DXY is the tailwind, and a DXY reclaim of its own breakdown level is the risk to watch. See the live levels below, and the current read in the Synthesis section.
| Level | Price | Means |
|---|---|---|
| Correction done → new highs | 3,990 | Chase-worthy again |
| Bigger A-B-C engaged | 3,747.2 | The blow-off correction has another leg down |
| Upside targets | 6,666 / 8,040 | If the correction is done |
The 2021 high Bearish
VNQ · real estate, the most rate-sensitive equity sleeve.
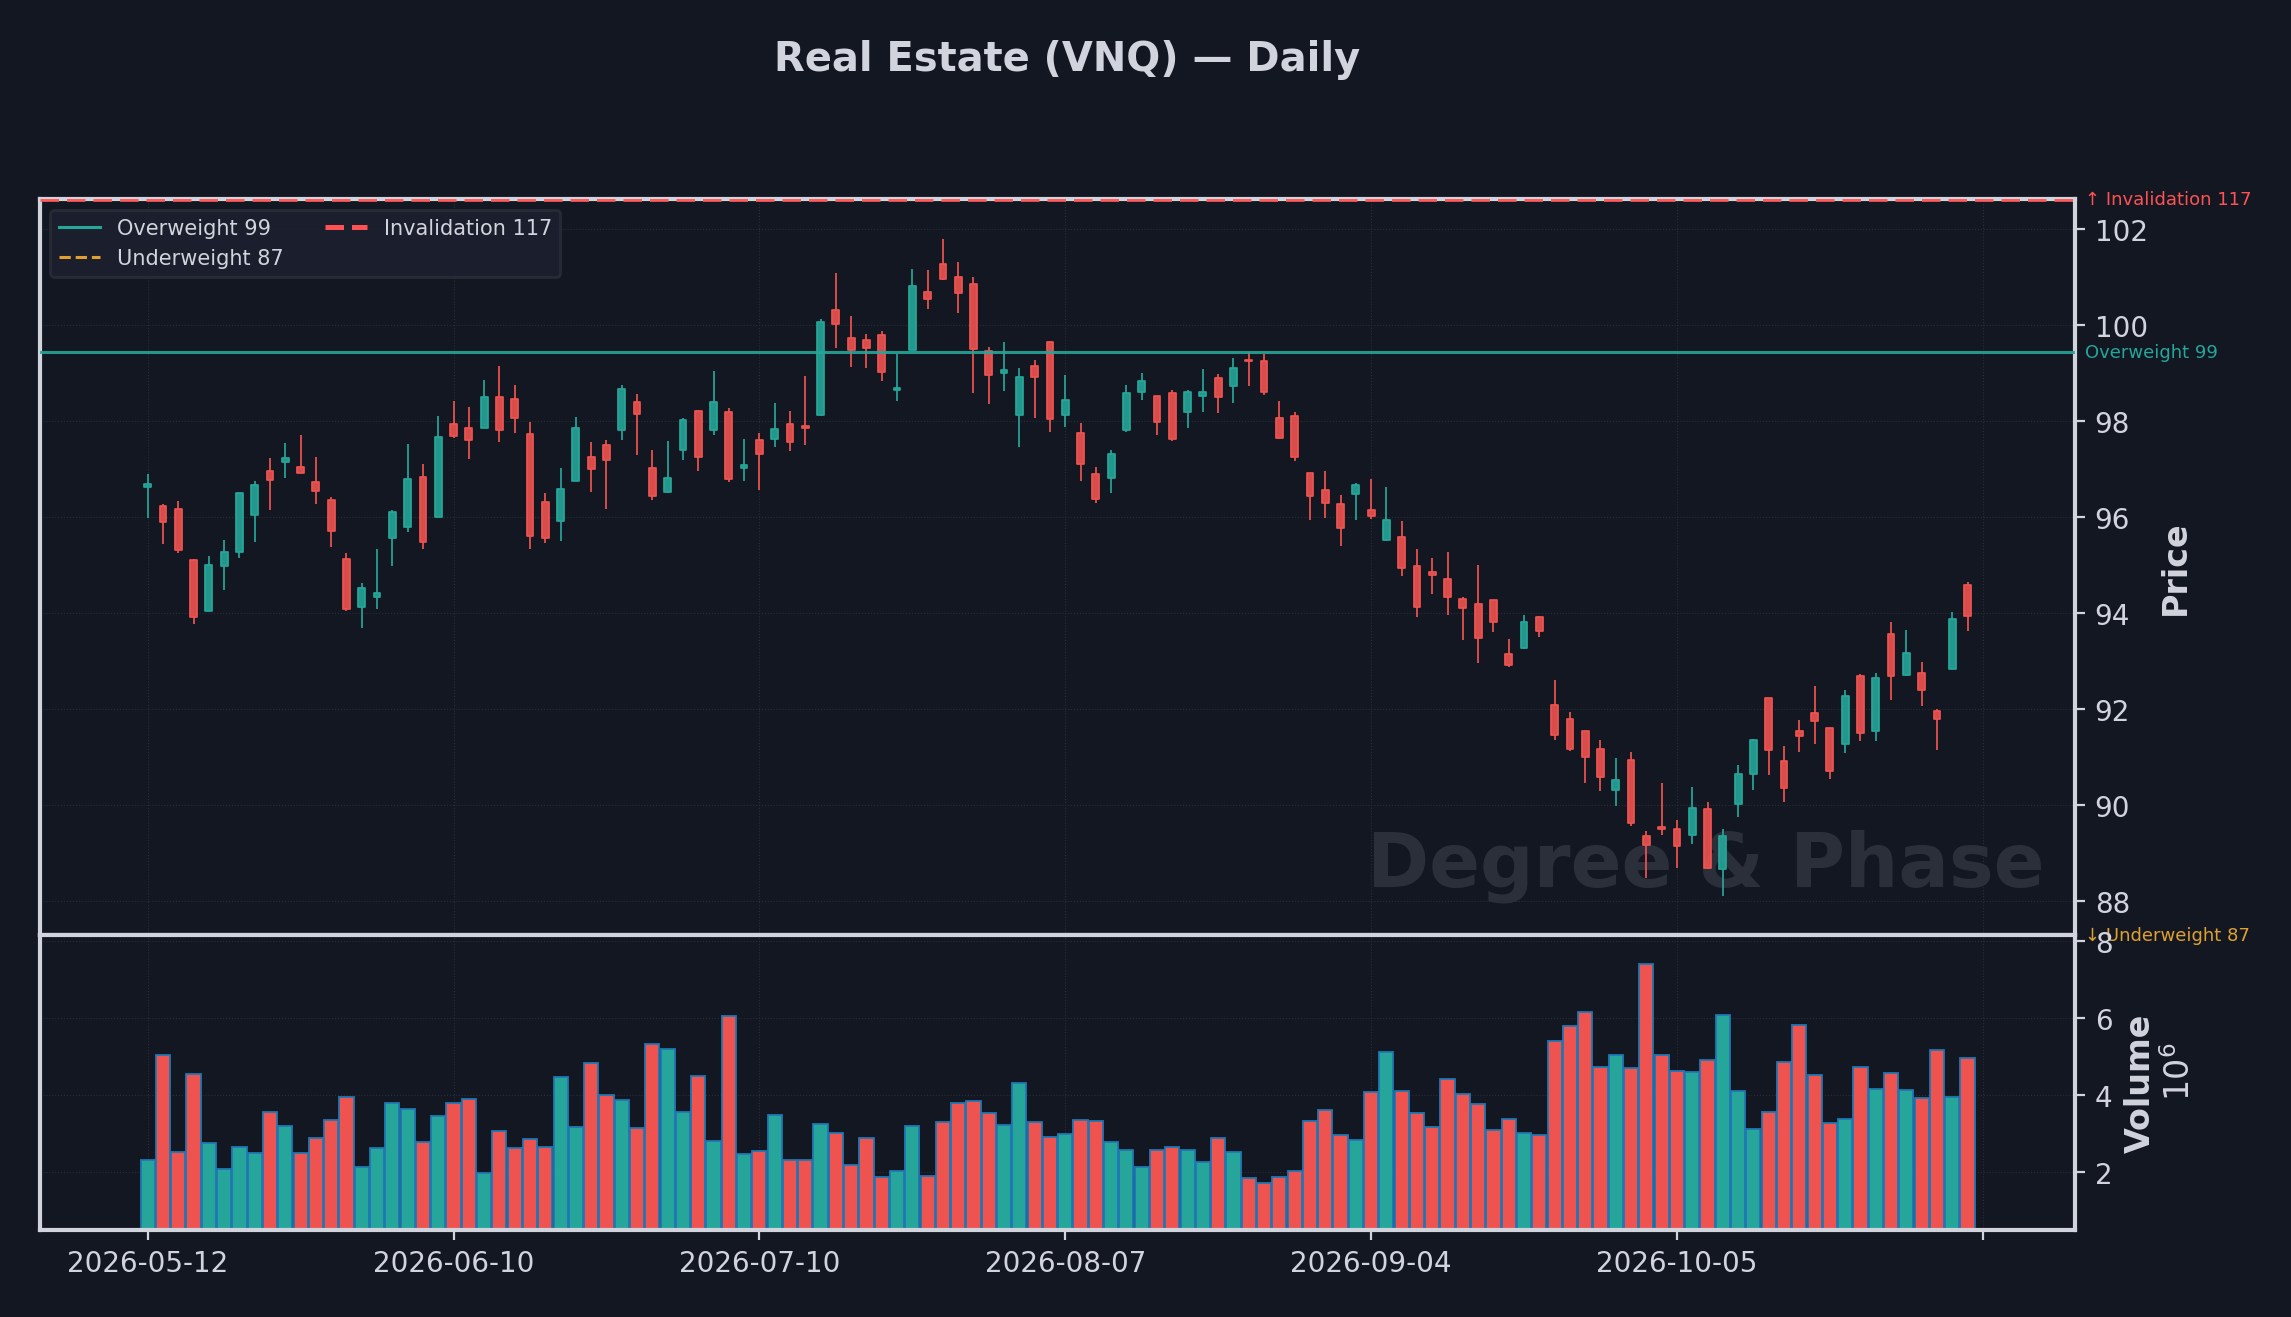
The 2023 recovery never got VNQ back to its 2021 peak (116.71), and that recovery reads as corrective, not a new bull, the setup for a wave-C decline rather than a fresh advance. REITs are also the equity sleeve most directly exposed to the same rate cycle that drives the bonds sleeve: when long rates break to new lows, real estate tends to take the hit hardest. A weekly reclaim of the prior recovery high would ease this toward a neutral read. See the live levels below, and the current read in the Synthesis section.
| Level | Price | Means |
|---|---|---|
| Cuts the bearish read | 99.43 | The old "rates up, REITs down" reflex has broken |
| Deepens | 86.84 → 70.61 | The wave-C decline confirms and extends |
The secular bear Bearish
Bonds · long-duration Treasuries, the rate-cycle benchmark.
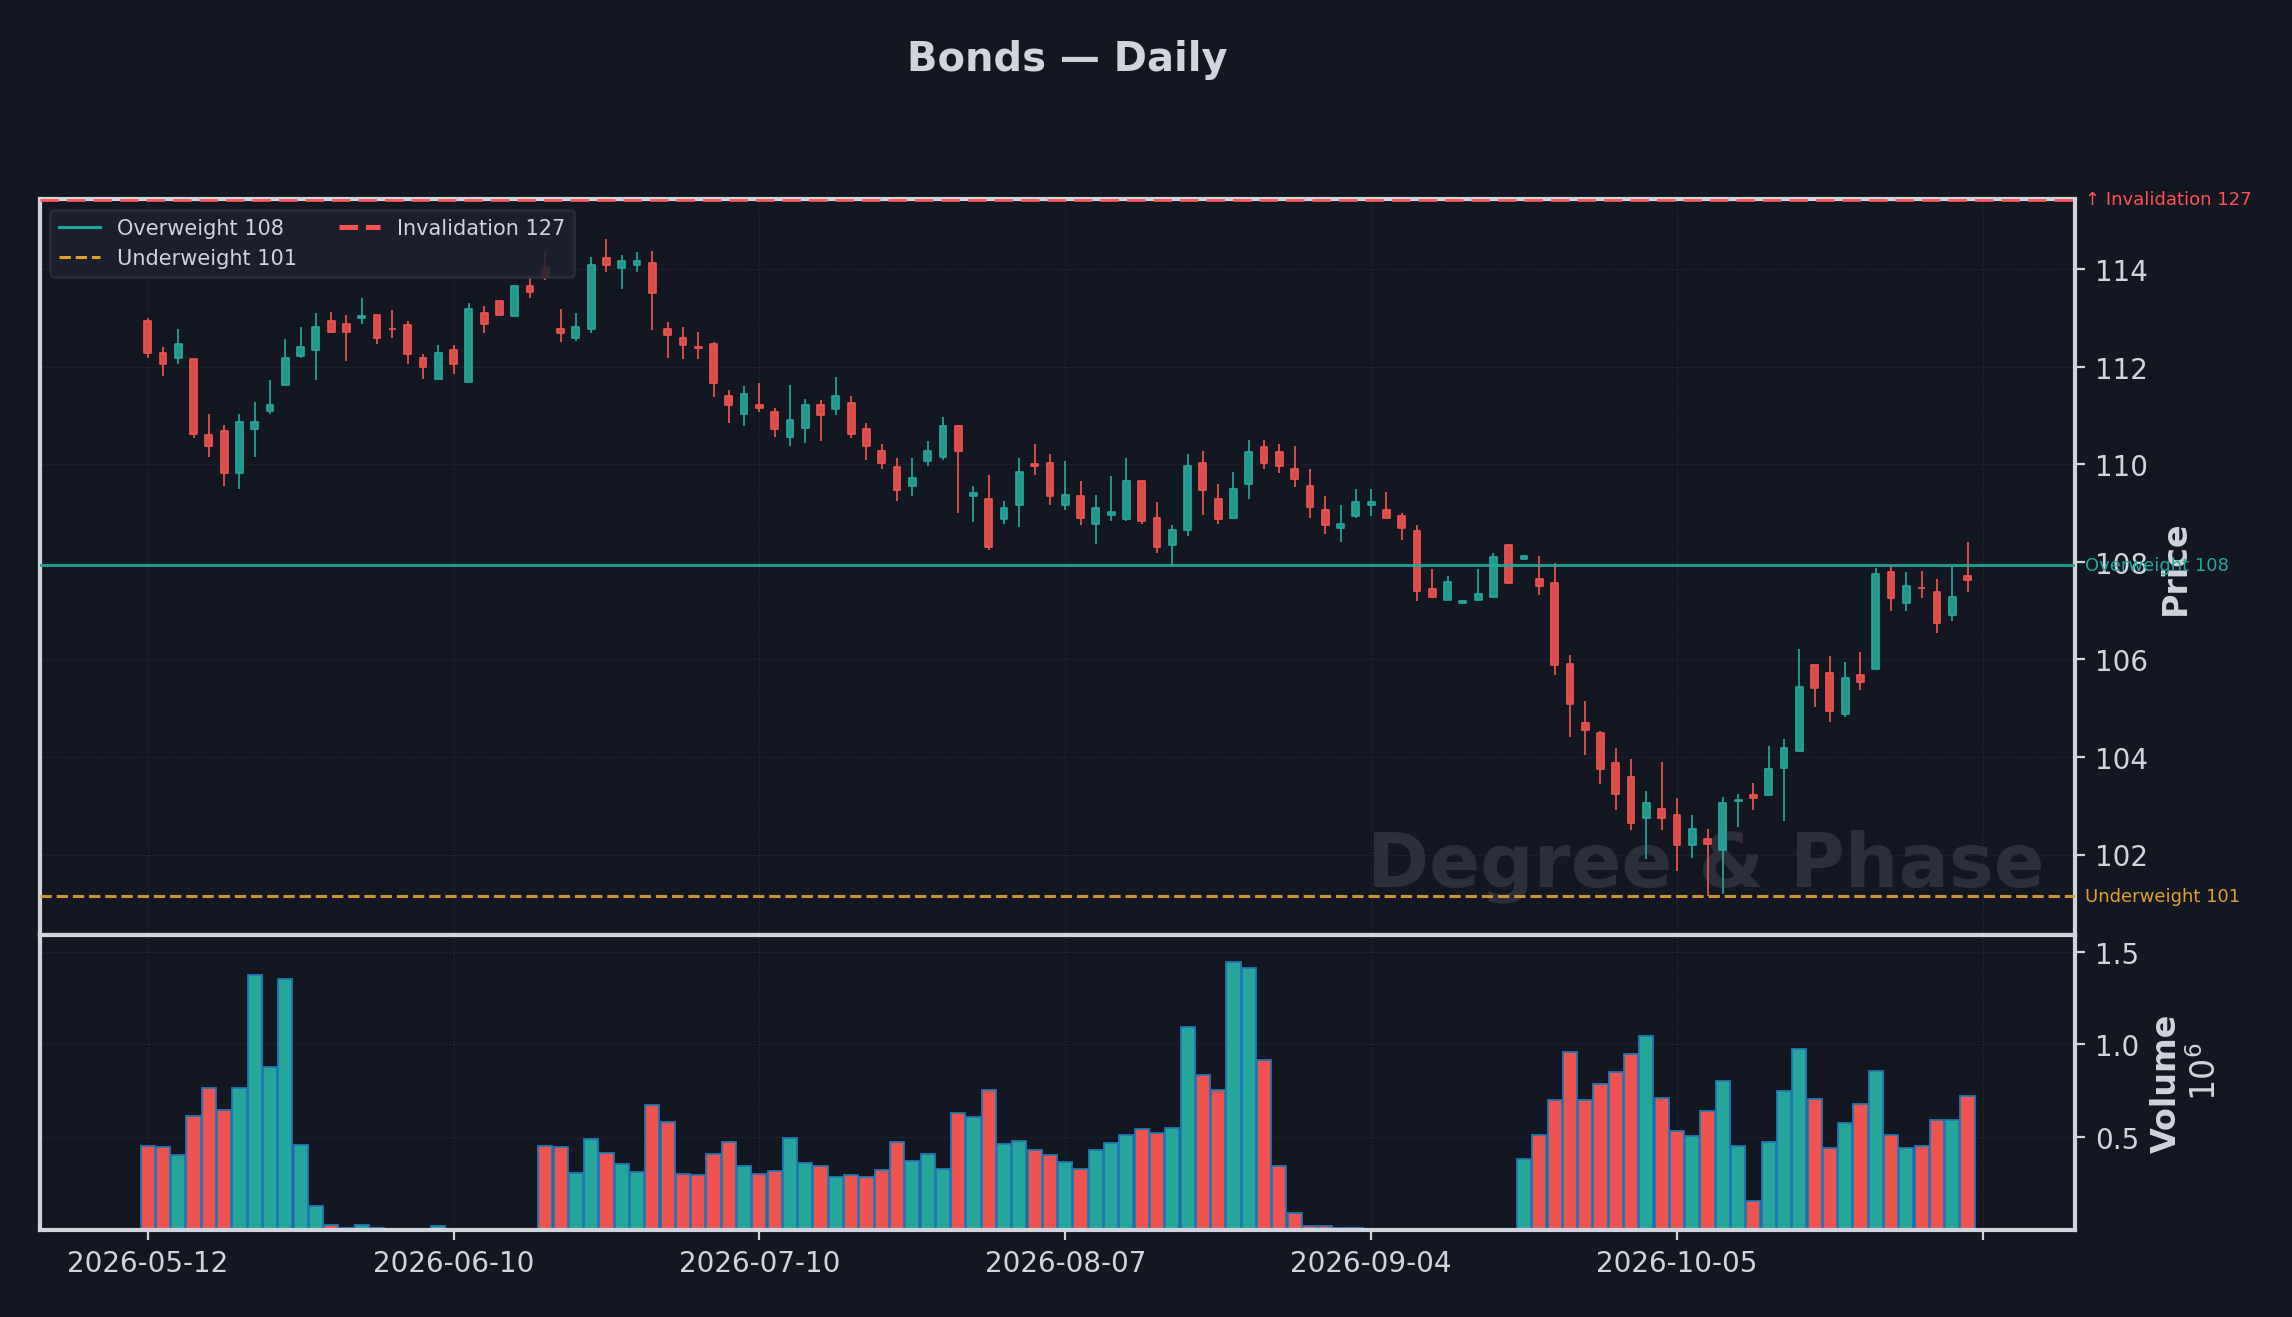
The 40-year bond bull ended in 2020, and the multi-year range that followed eventually resolved to the downside, with TLT confirming the break on a weekly close. That kind of resolution is consistent with the most damaging phase of a secular bear market, where the trend accelerates rather than digests. A weekly reclaim of the level in the table below is what would put that read in question. See the live levels below, and the current read in the Synthesis section.
| Level (30-yr futures) | Price | Means |
|---|---|---|
| Base confirmed | 107.9375 | Duration turns; ~5% was the ceiling |
| Secular bear wave 3 | 101.15 | Another leg down; 30-yr toward 6–7% |
What it adds up to
The cross-sleeve read is held back pending review this week; the six panels above stand on their own.
The tells that flip it.
SPX flips when the index breaks the defended shelf and loses the reclaim line on a session close. INTL flips the other way on a decisive loss of its rising support, which would surrender the leadership the sleeve currently carries. DXY flips on a sustained reclaim above the overhead pivot that has capped every rally. Gold flips back constructive on a reclaim of the broken shelf and a hold above it into the close. VNQ flips on a reclaim of the prior breakdown level, not before. Bonds flip on a reclaim of the pivot that defines the downtrend, which would mark the first structural break in the sequence.
Where these reads come from.
- The Fed's hawkish flip, delivered: FOMC minutes: the Committee raised the target range to 3.75 to 4 percent, with most participants seeing another increase likely by year end (released Oct 7).
- The oil shock persists: Trading Economics: WTI near 91.66 a barrel, with the US-Iran conflict still straining Strait of Hormuz flows (Oct 9).
- The dollar, firming as the driver: FXStreet: DXY near 102.25, just under Monday's 18-month high near 102.50, as the Fed's hawks repeat the case for another hike (Oct 9).
- Gold, holding up against a firm dollar: PriceGold: spot gold at 4,143.94 an ounce, in a 4,119 to 4,176 range on the day (Oct 6).
- The long bond: MacroRadar: the 30-year Treasury yield at 5.67 percent, the highest in its 20-year series (Oct 7).
- The real cost of money, still climbing: FRED: the 10-year real yield (TIPS) at 2.87 percent, up from 2.43 percent a month earlier (Oct 8).
Higher Degree is for members.
The monthly macro read moves behind membership as the site grows. When it opens, membership runs about $100 a month. Join the free list now and you are grandfathered in at a founding rate far below that, locked for as long as you stay a member.
Lock the founding rate. Join free today, and when membership opens at about $100 a month, you pay far less, for good.