The weekly Nasdaq read places the Nasdaq-100 in its Elliott Wave structure, counted on NQ futures and charted on QQQ, then cross-validated against the Magnificent 7. Each read gives the bias, the levels that confirm or kill it, and the exact price that proves it wrong. Free, every week.
The chart, live.
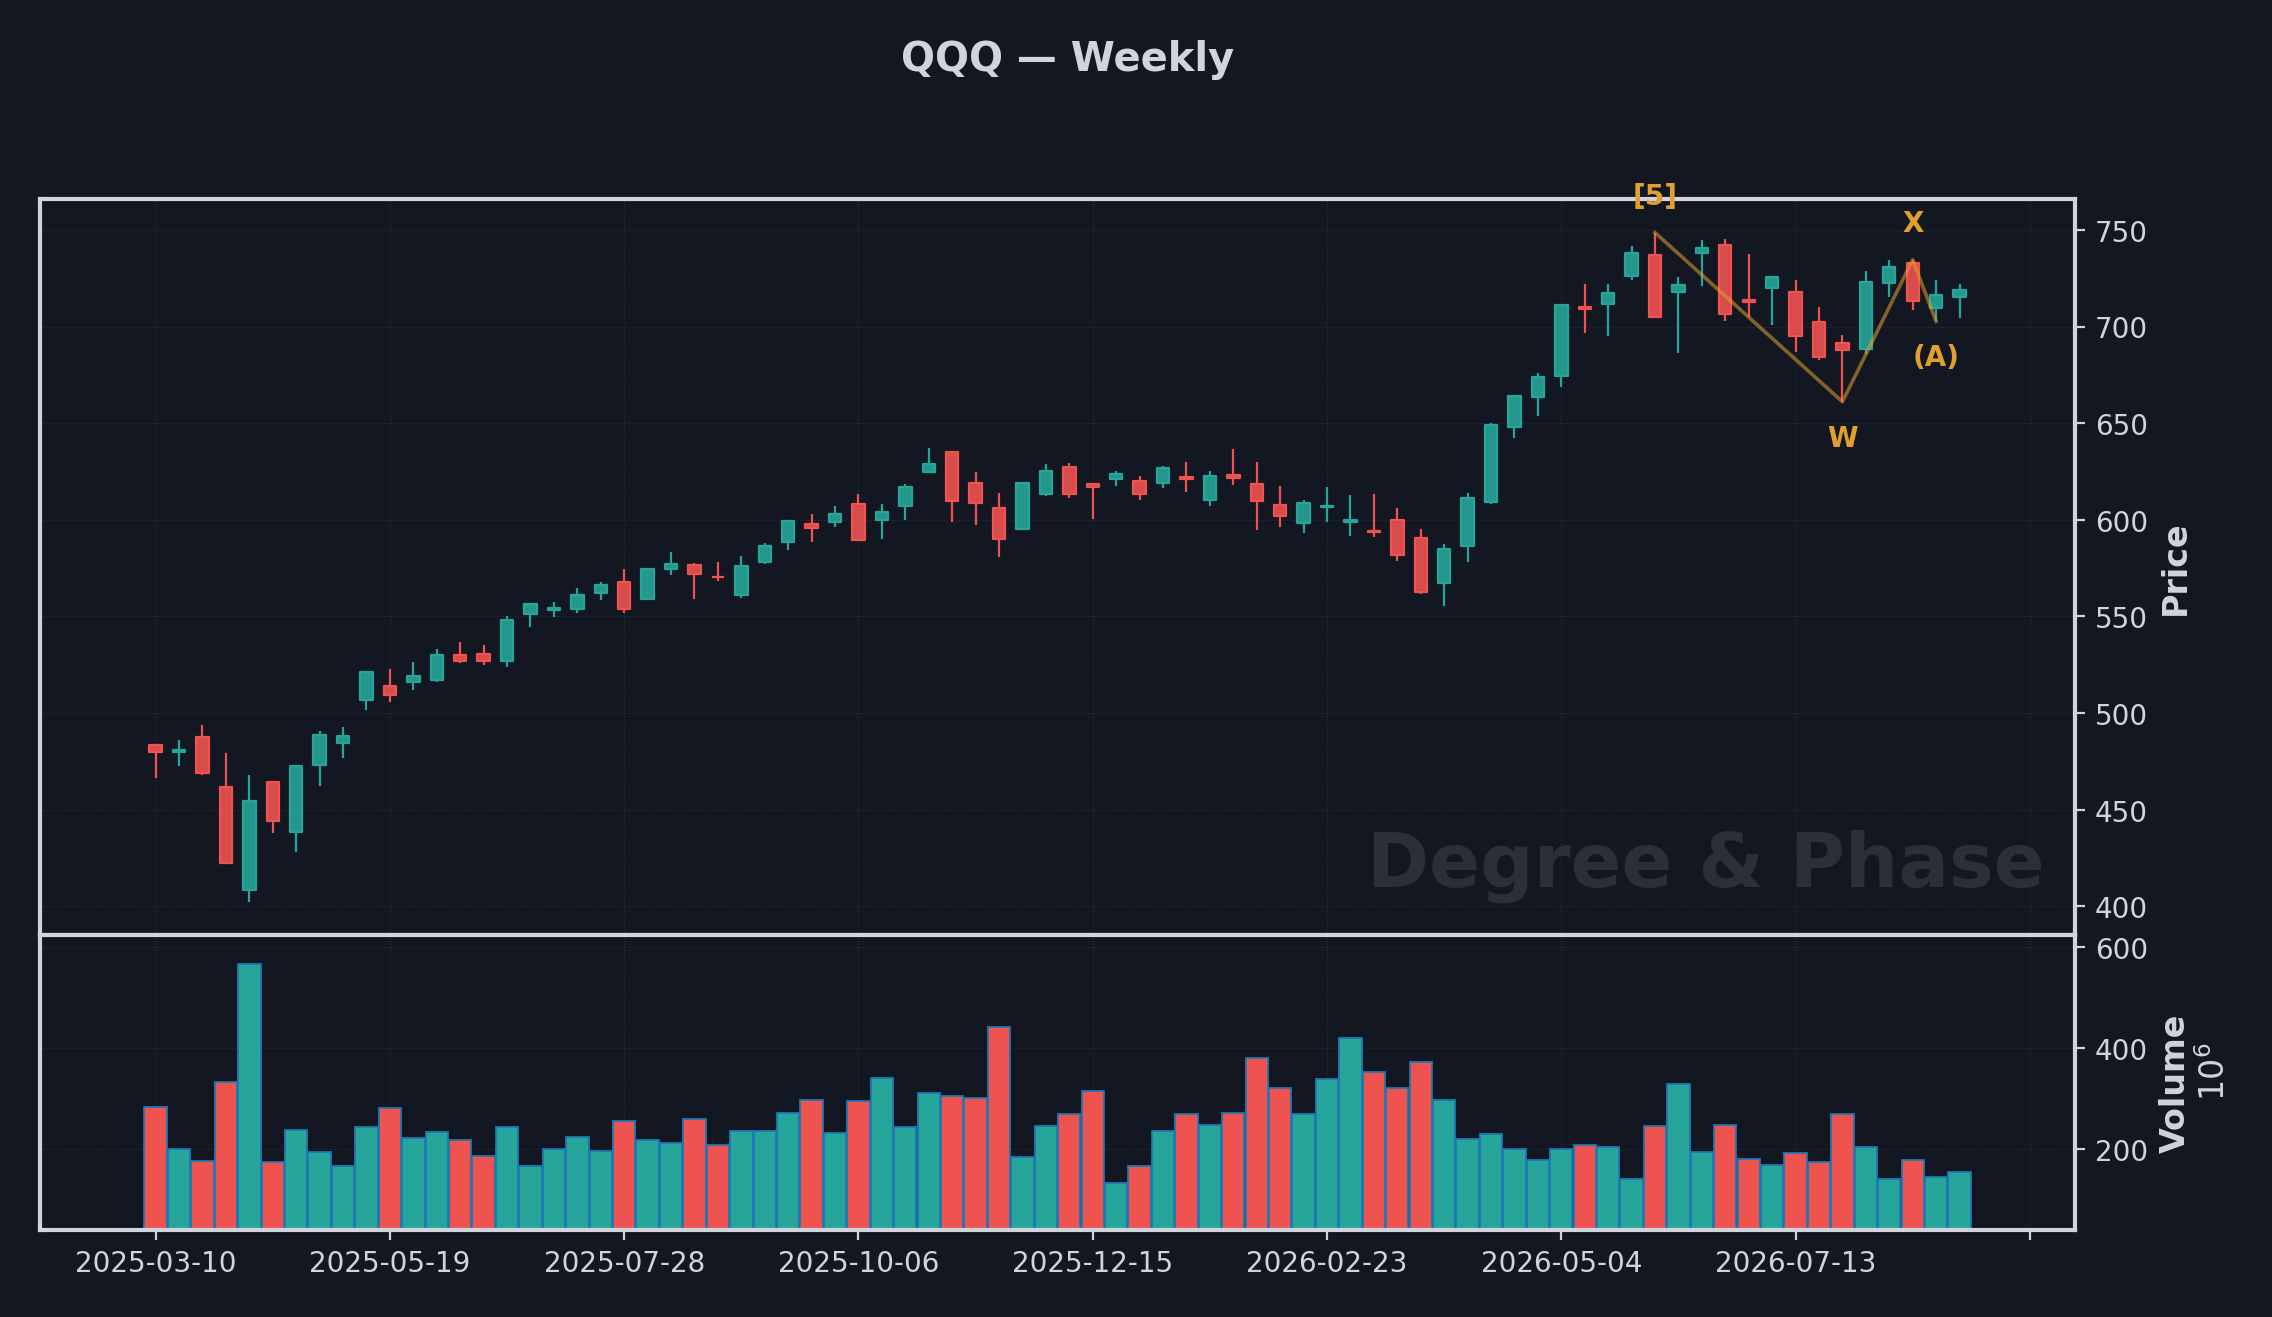
QQQ is the tradable proxy for the Nasdaq-100 and the instrument we chart here, a clean, unambiguous license. The structural work is done on NQ futures; QQQ tracks it tick for tick and is what most readers can actually pull up.
What the data says right now.
NQ SHORT · QQQ SHORT
The written read is held back pending review this week; the levels below stand on their own. The cross-validation composite across the eight heaviest names reads −0.147.
Two paths, weighted
- 61%: Scenario F, primary (bearish). The leading read this week. See the levels table for exactly what confirms or kills it.
- 24%: Scenario C (bullish). The next most likely alternative.
- 15%: the rest. Lower-probability scenarios and refuted residuals.
Where it confirms or kills
| Level (NQ / QQQ) | Price | Means |
|---|---|---|
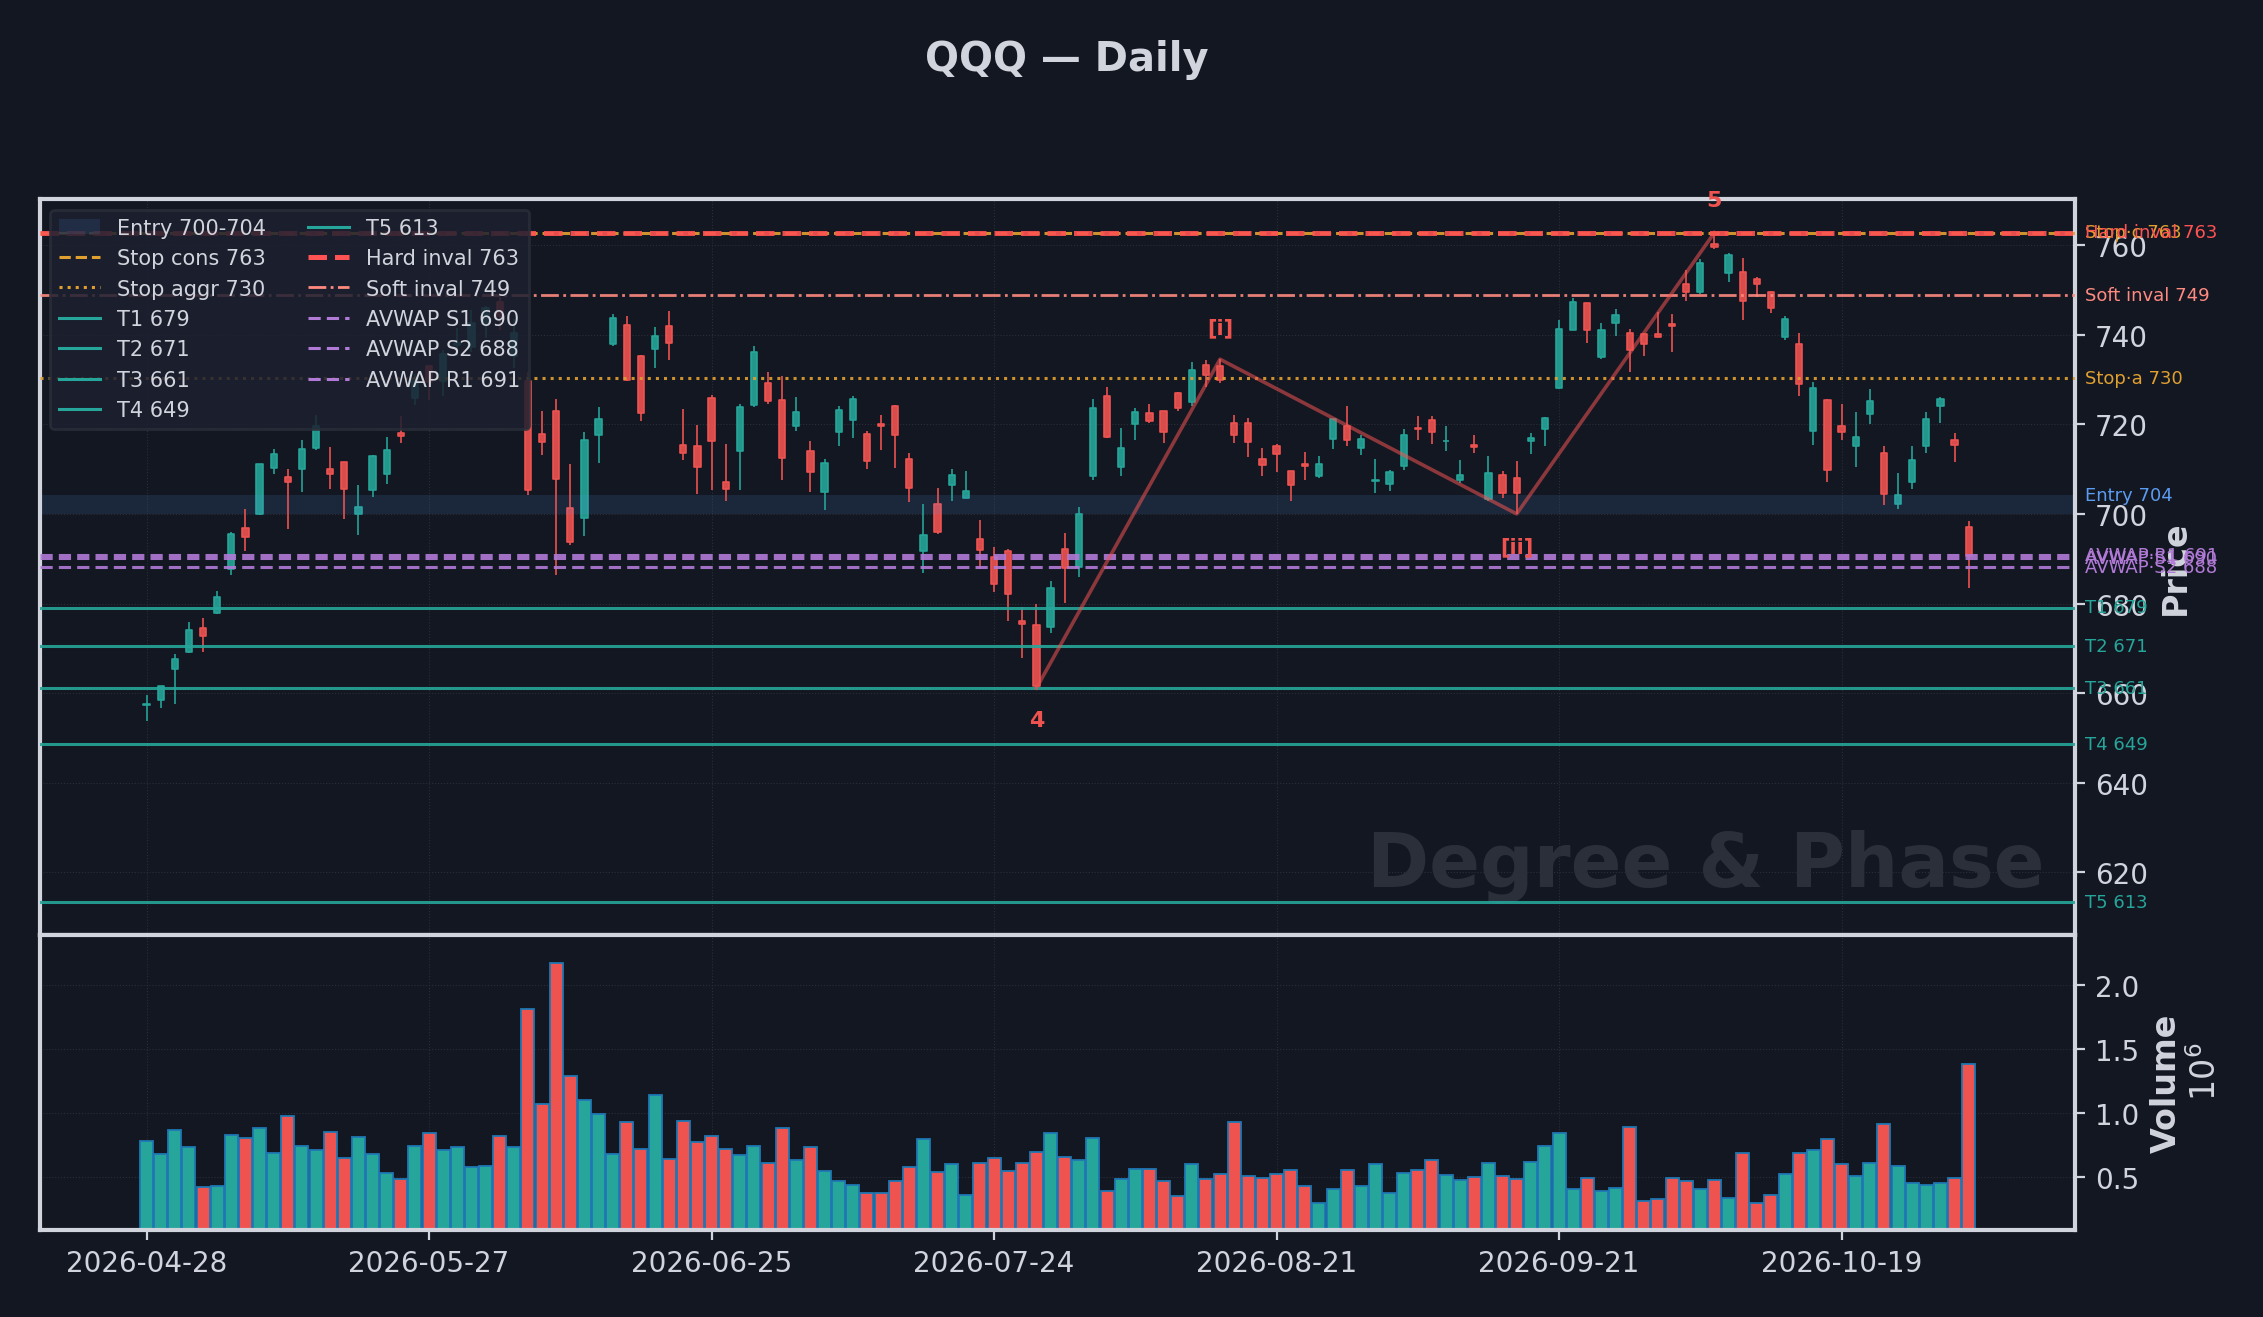
| Soft invalidation (QQQ) | 748.94 | The level that flips the primary scenario |
| Soft invalidation (NQ) | 30,939.25 | The single most important number in the book |
| Target 1 (NQ / QQQ) | 28,054.00 / 679.13 | The primary scenario's first objective |
| Hard invalidation (NQ) | 31,513.00 | A print here kills the primary scenario outright |
NQ 28,543.00 · QQQ $690.54 at the Oct 30 close. Structural confidence 53 (NQ) / 56 (QQQ).
The tells I'm watching
- A move through NQ 30,939.25 (QQQ 748.94), the soft-invalidation level: the first sign the primary scenario needs a second look.
- A sustained close through NQ 28,054.00 (QQQ 679.13), the primary scenario's Target 1: confirms it's playing out, with 27,495.00 further out as an extension objective.
- A print at NQ 31,513.00, the hard-invalidation level: kills the primary scenario outright.
The weekly read is free.
This page updates every week: bias, levels, and what would change it. Get it in your inbox the moment it publishes.
Free forever. The setups behind it are for members.