Trade setups turn the weekly wave read into specific trades: each one carries a direction, a one-sentence thesis, an entry, a hard stop, five scaled targets, and an honest conviction level. Structure-derived, never gut calls, and every setup shows the price that invalidates it.
What a setup actually looks like.
These are drawn from the Oct 30 cross-validation: real levels, shown to illustrate the format. The honest headline first: the index setups rarely carry high conviction, so the conviction lives in single names. Every setup carries the same anatomy: direction, thesis in a sentence, the exact levels, and how much conviction the structure earns. Educational and illustrative only. See the disclaimer at the foot of the page.
GOOG setup Oct 30
Chart · Oct 30 daily →
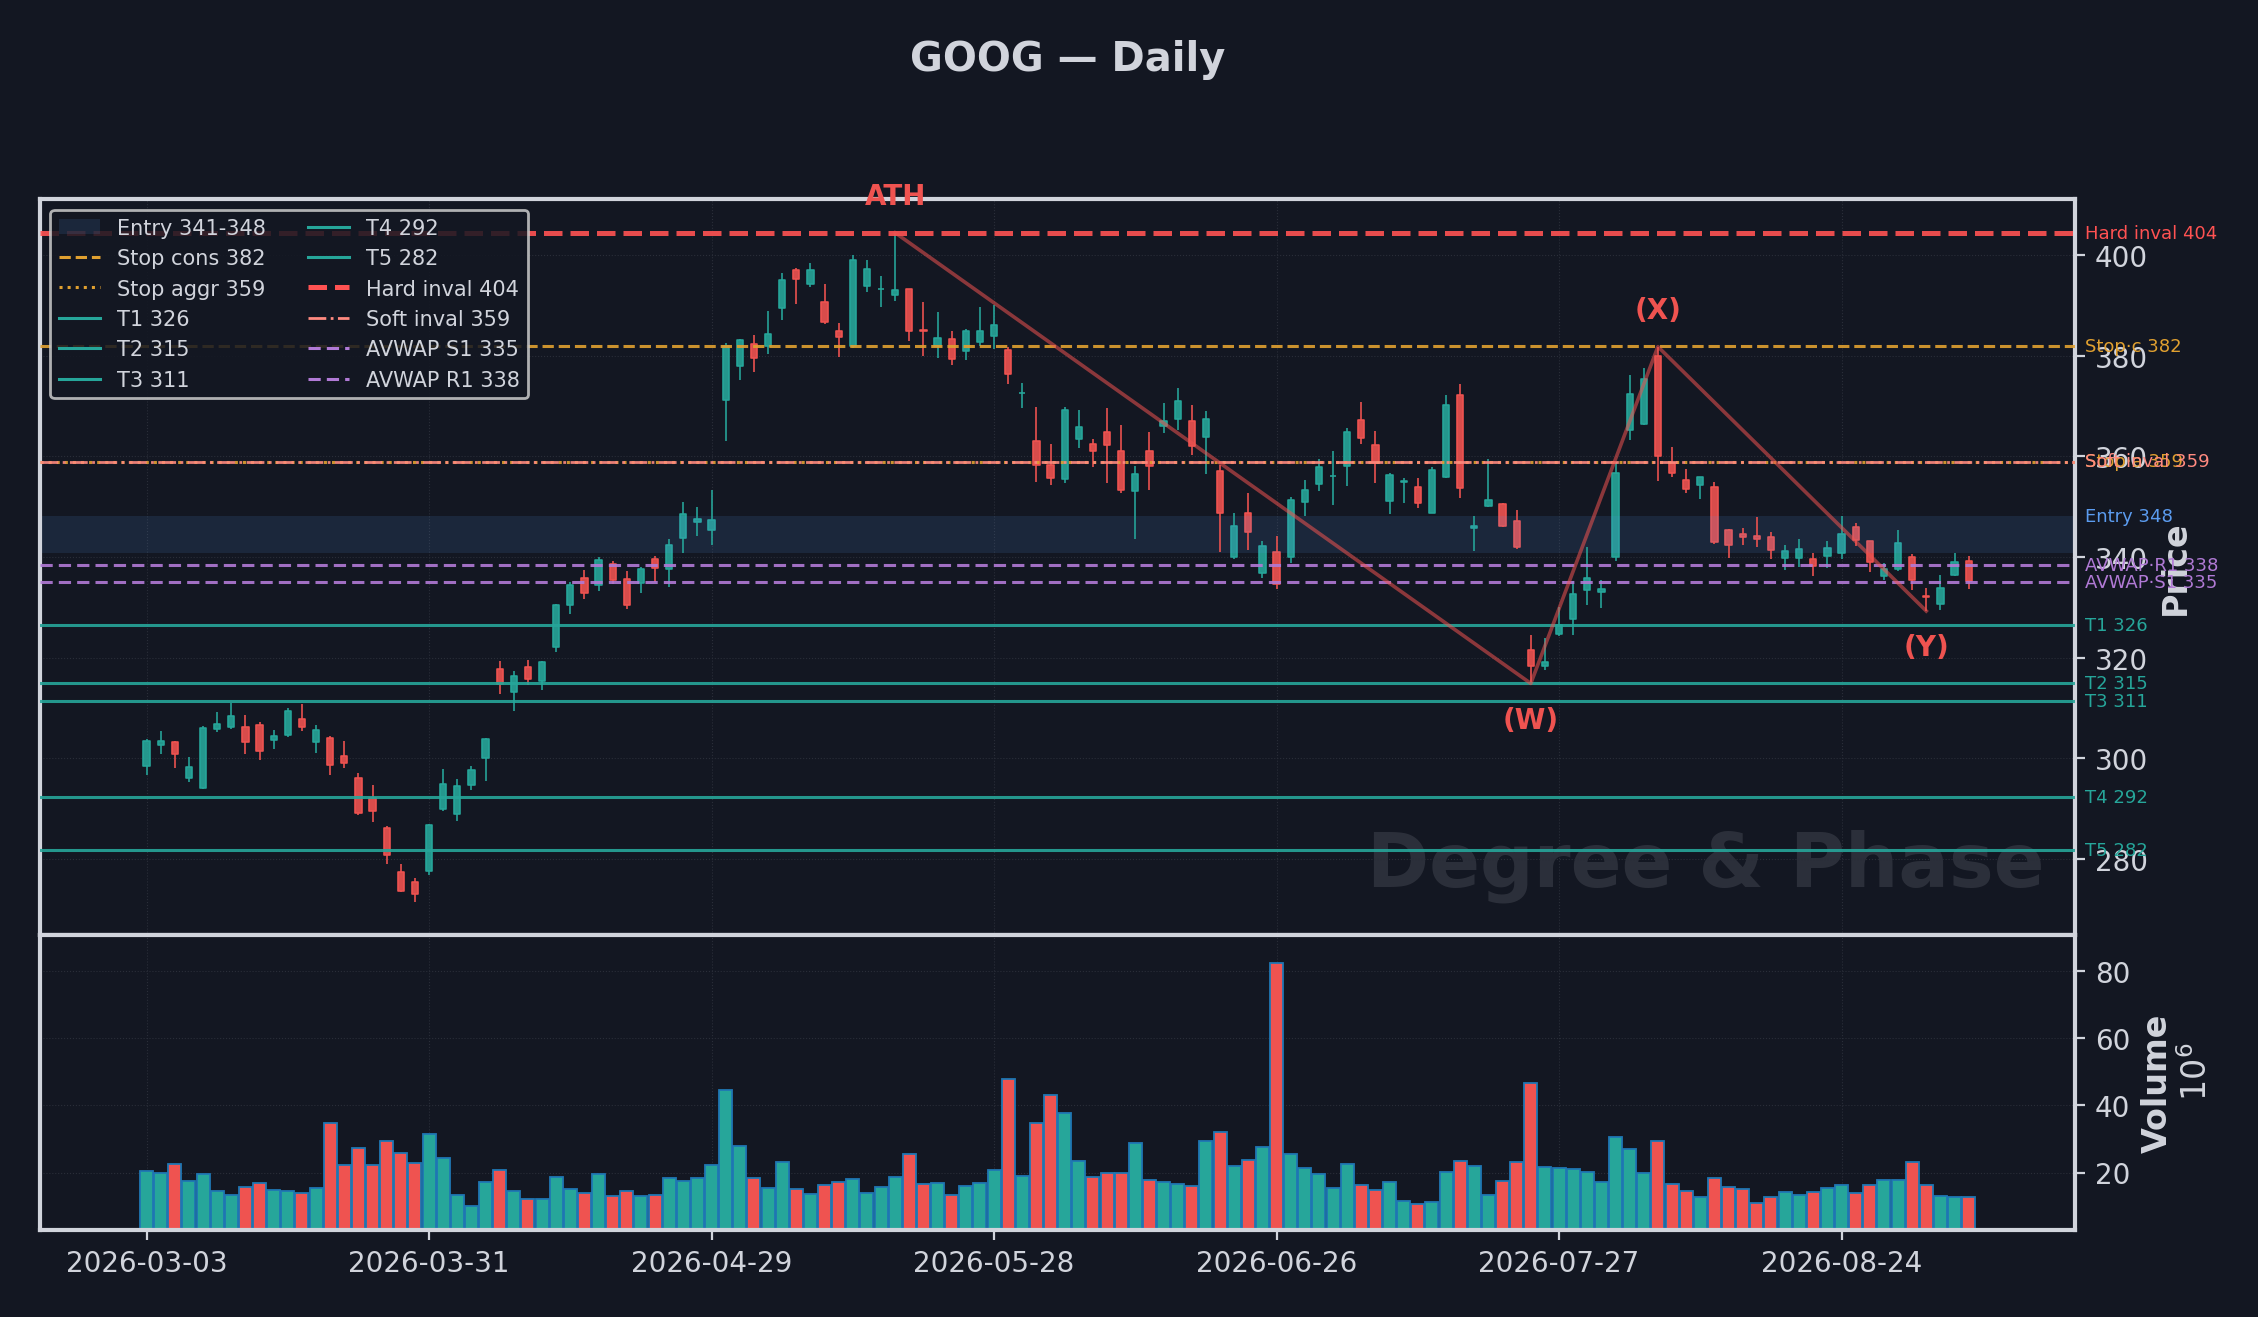
GOOG reads bearish. The post-earnings break drove price through the prior support band, and the structure now owes a deeper leg before the correction completes. The directional trigger at 276.40 is the pivot: pressure stays with the sellers while the stock holds below it, with the path reaching for 271.54, then 267.92, and extending toward 236.93 if supply keeps absorbing bids at 282.00. 278.88 is the near reference buyers must defend to stall the markdown, but a reclaim there does not undo the thesis on its own. The read ends on a sustained push through 404.44; short of that, every bounce is a selling opportunity against the broken structure.
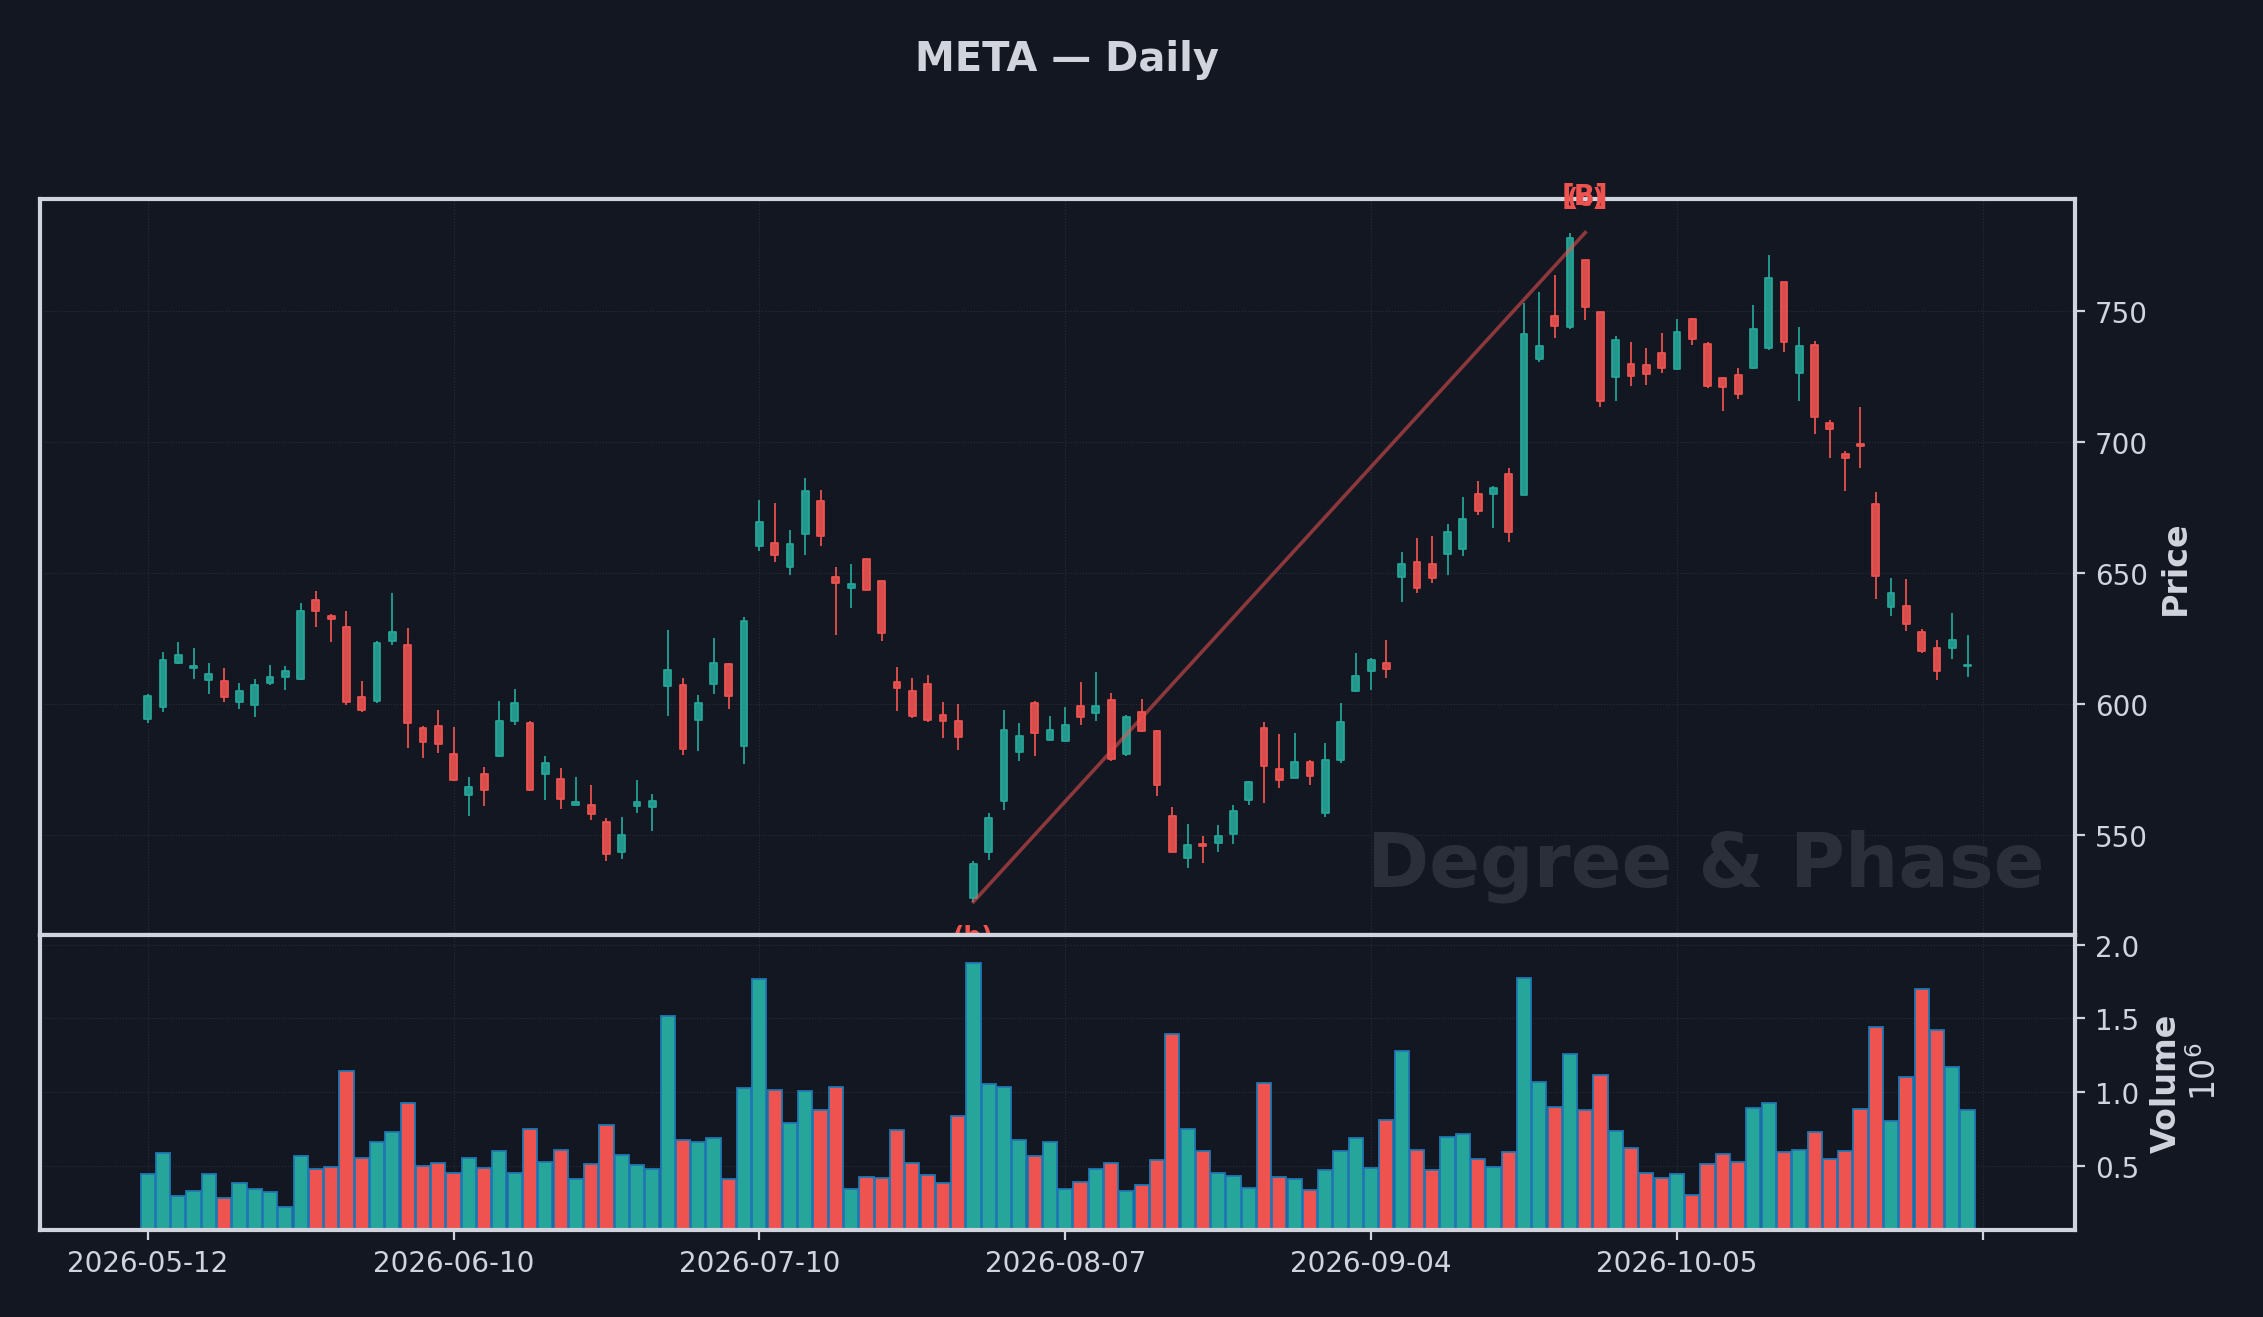
META setup Oct 30
Chart · Oct 30 daily →
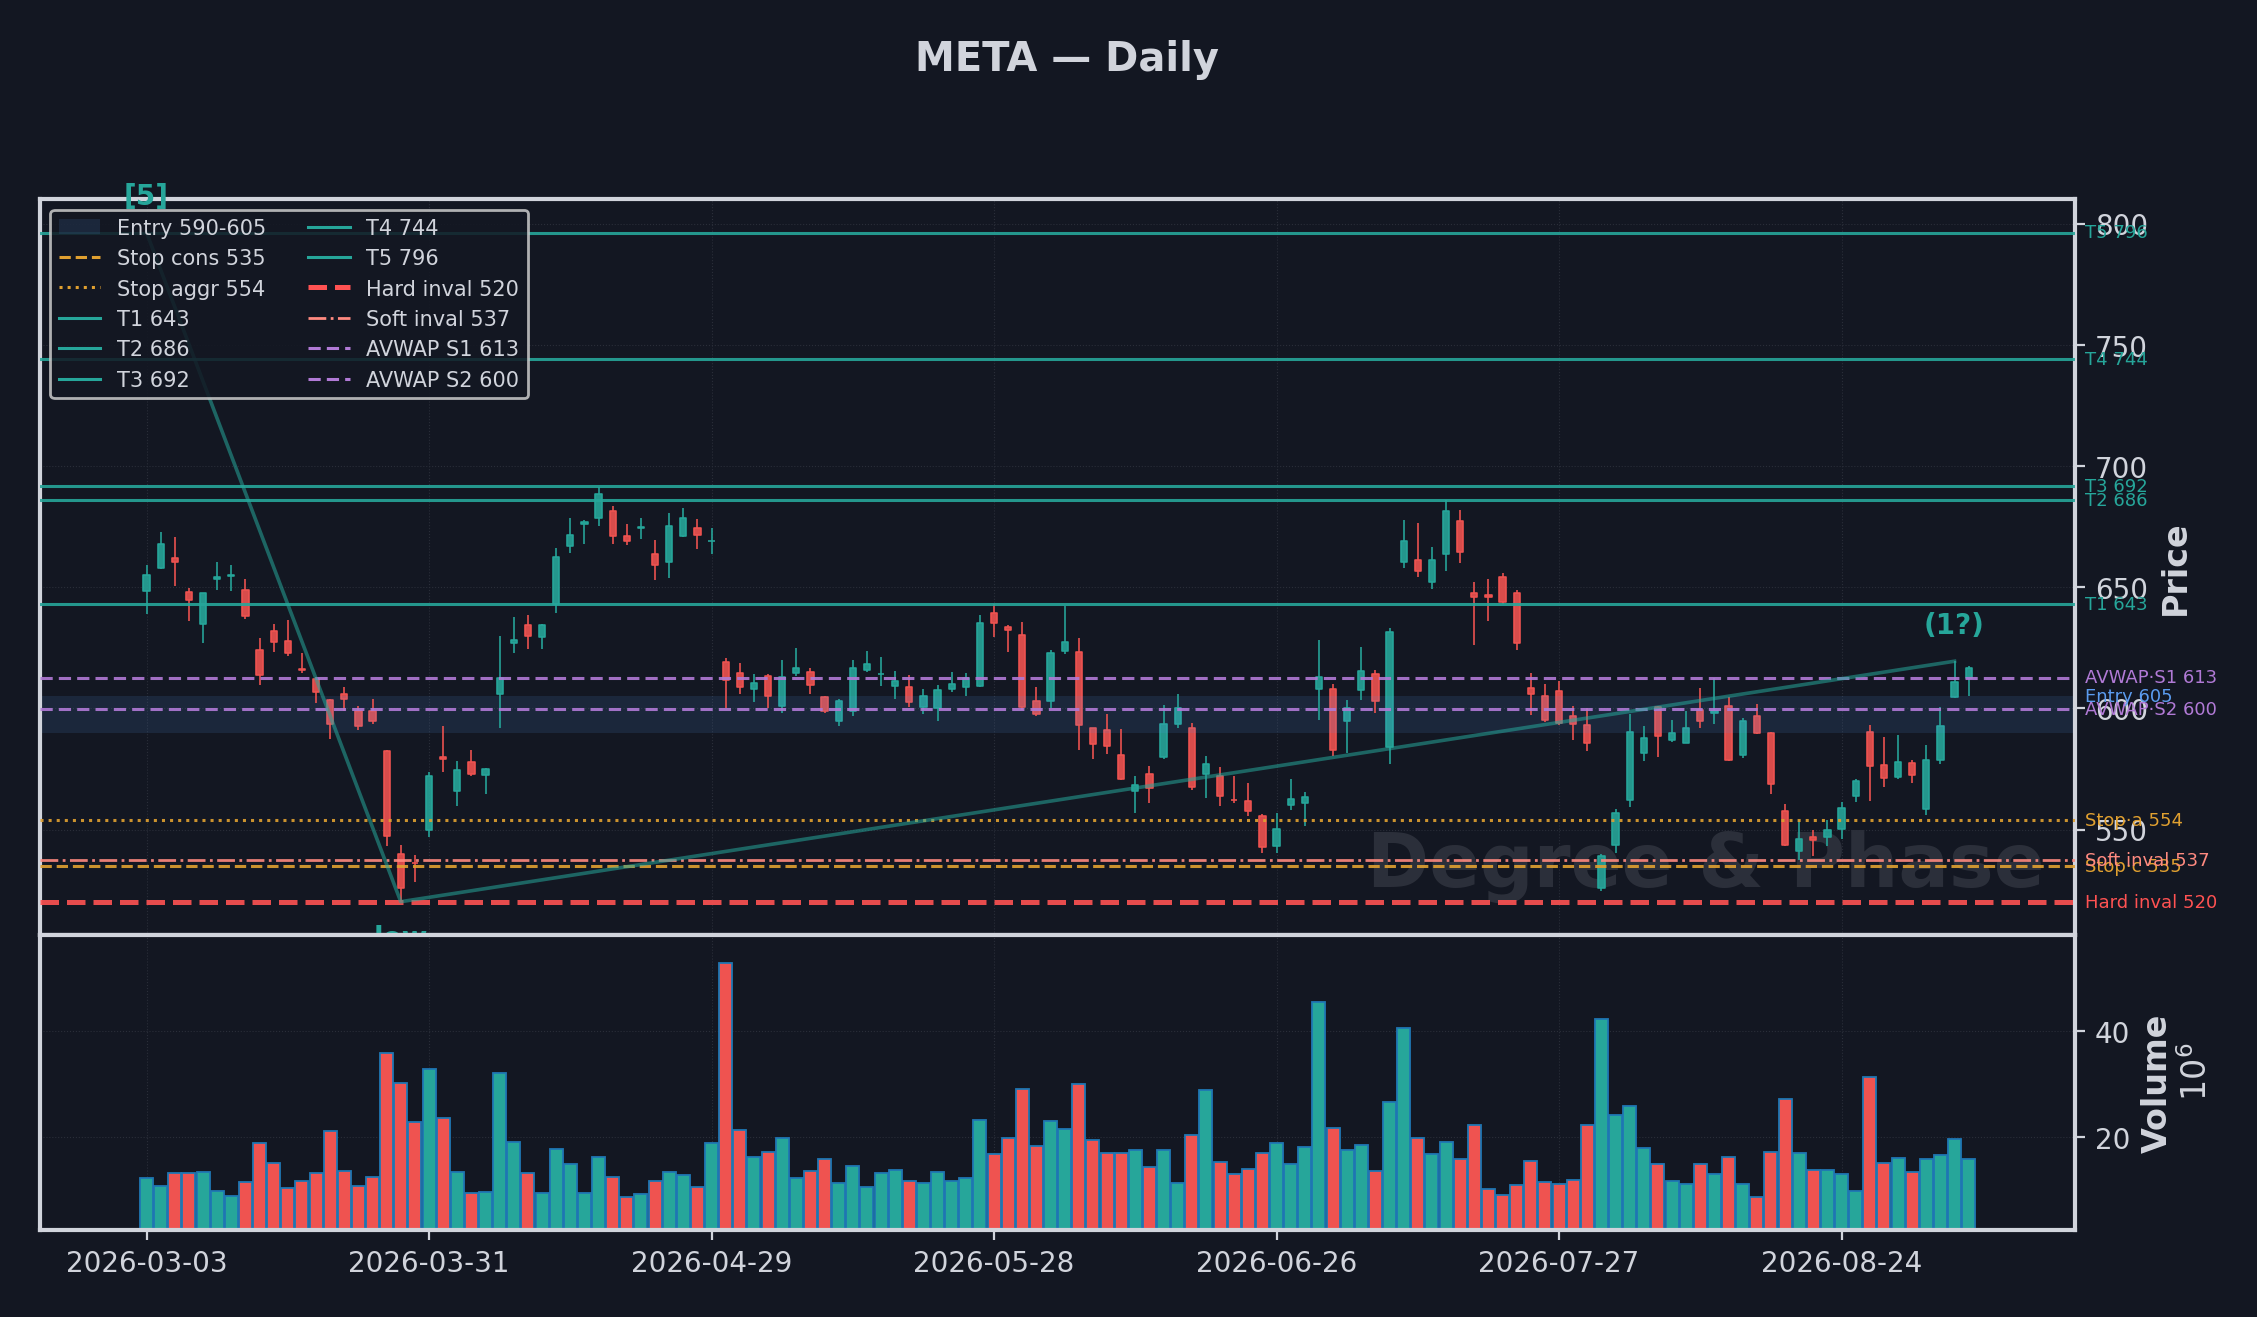
META reads bearish. The rally off the prior low was a corrective bounce inside a larger topping structure, and the next leg down is the one still owed; the first downside objective at 609.24 has already been pressed, and a met target is not a finished move. The path from here runs 609.24 to 593.27, with room to extend toward 556.13 and ultimately 524.50 if sellers keep the tape under 620.70. A sustained reclaim above 796.25 ends the argument and the short comes off; until then, the structure owes lower.
NVDA setup Oct 30
Chart · Oct 30 daily →
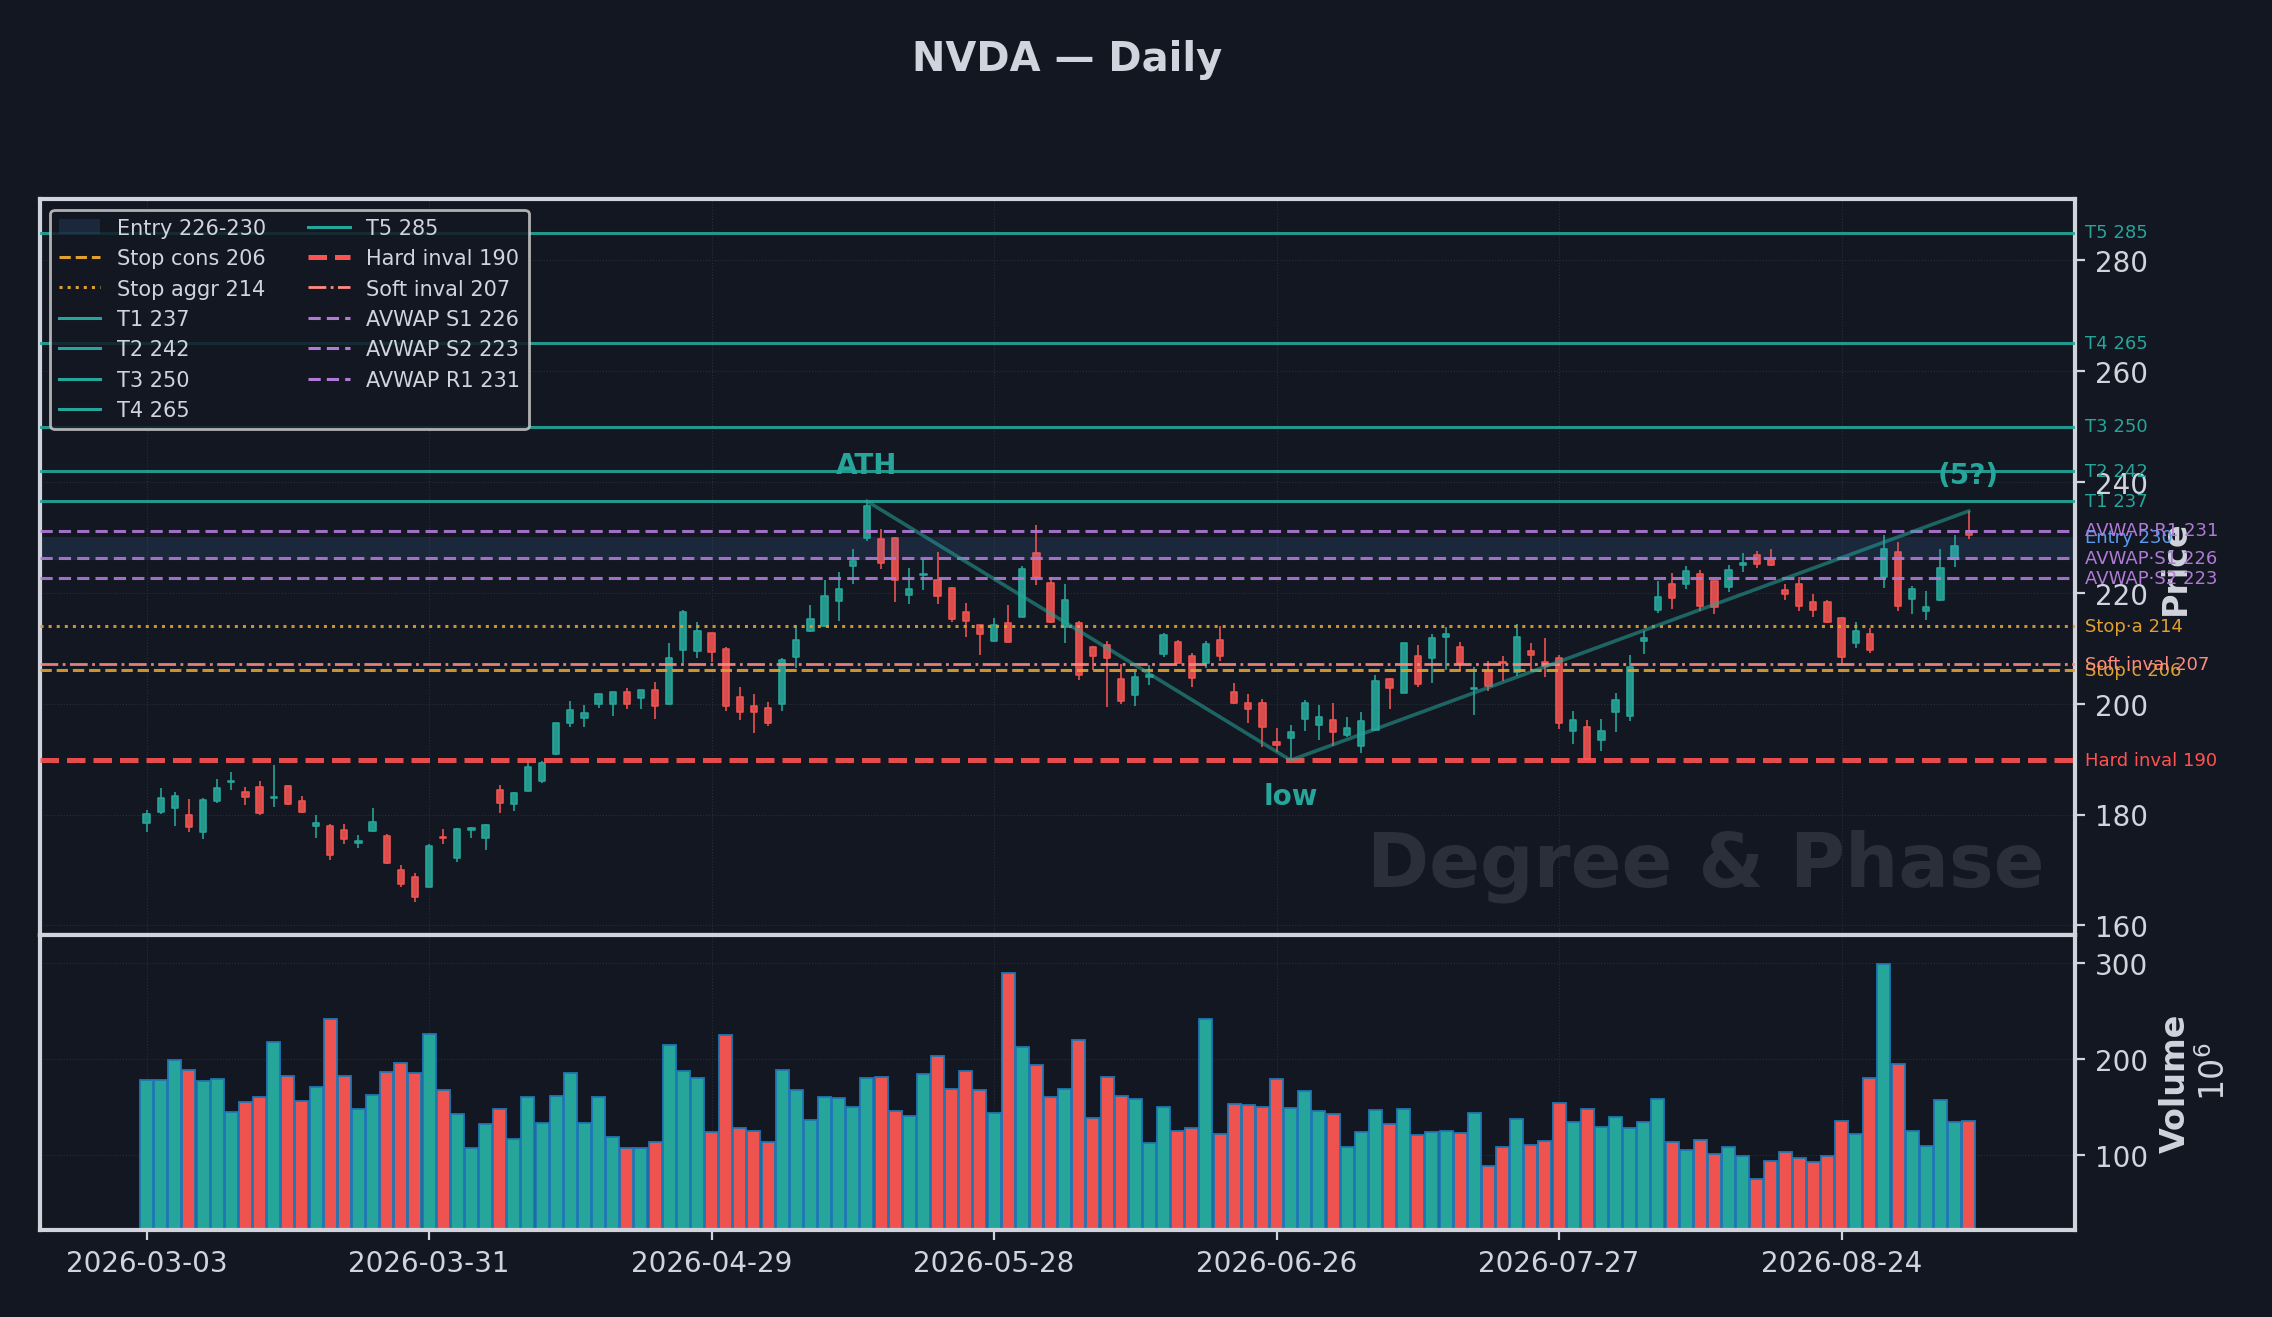
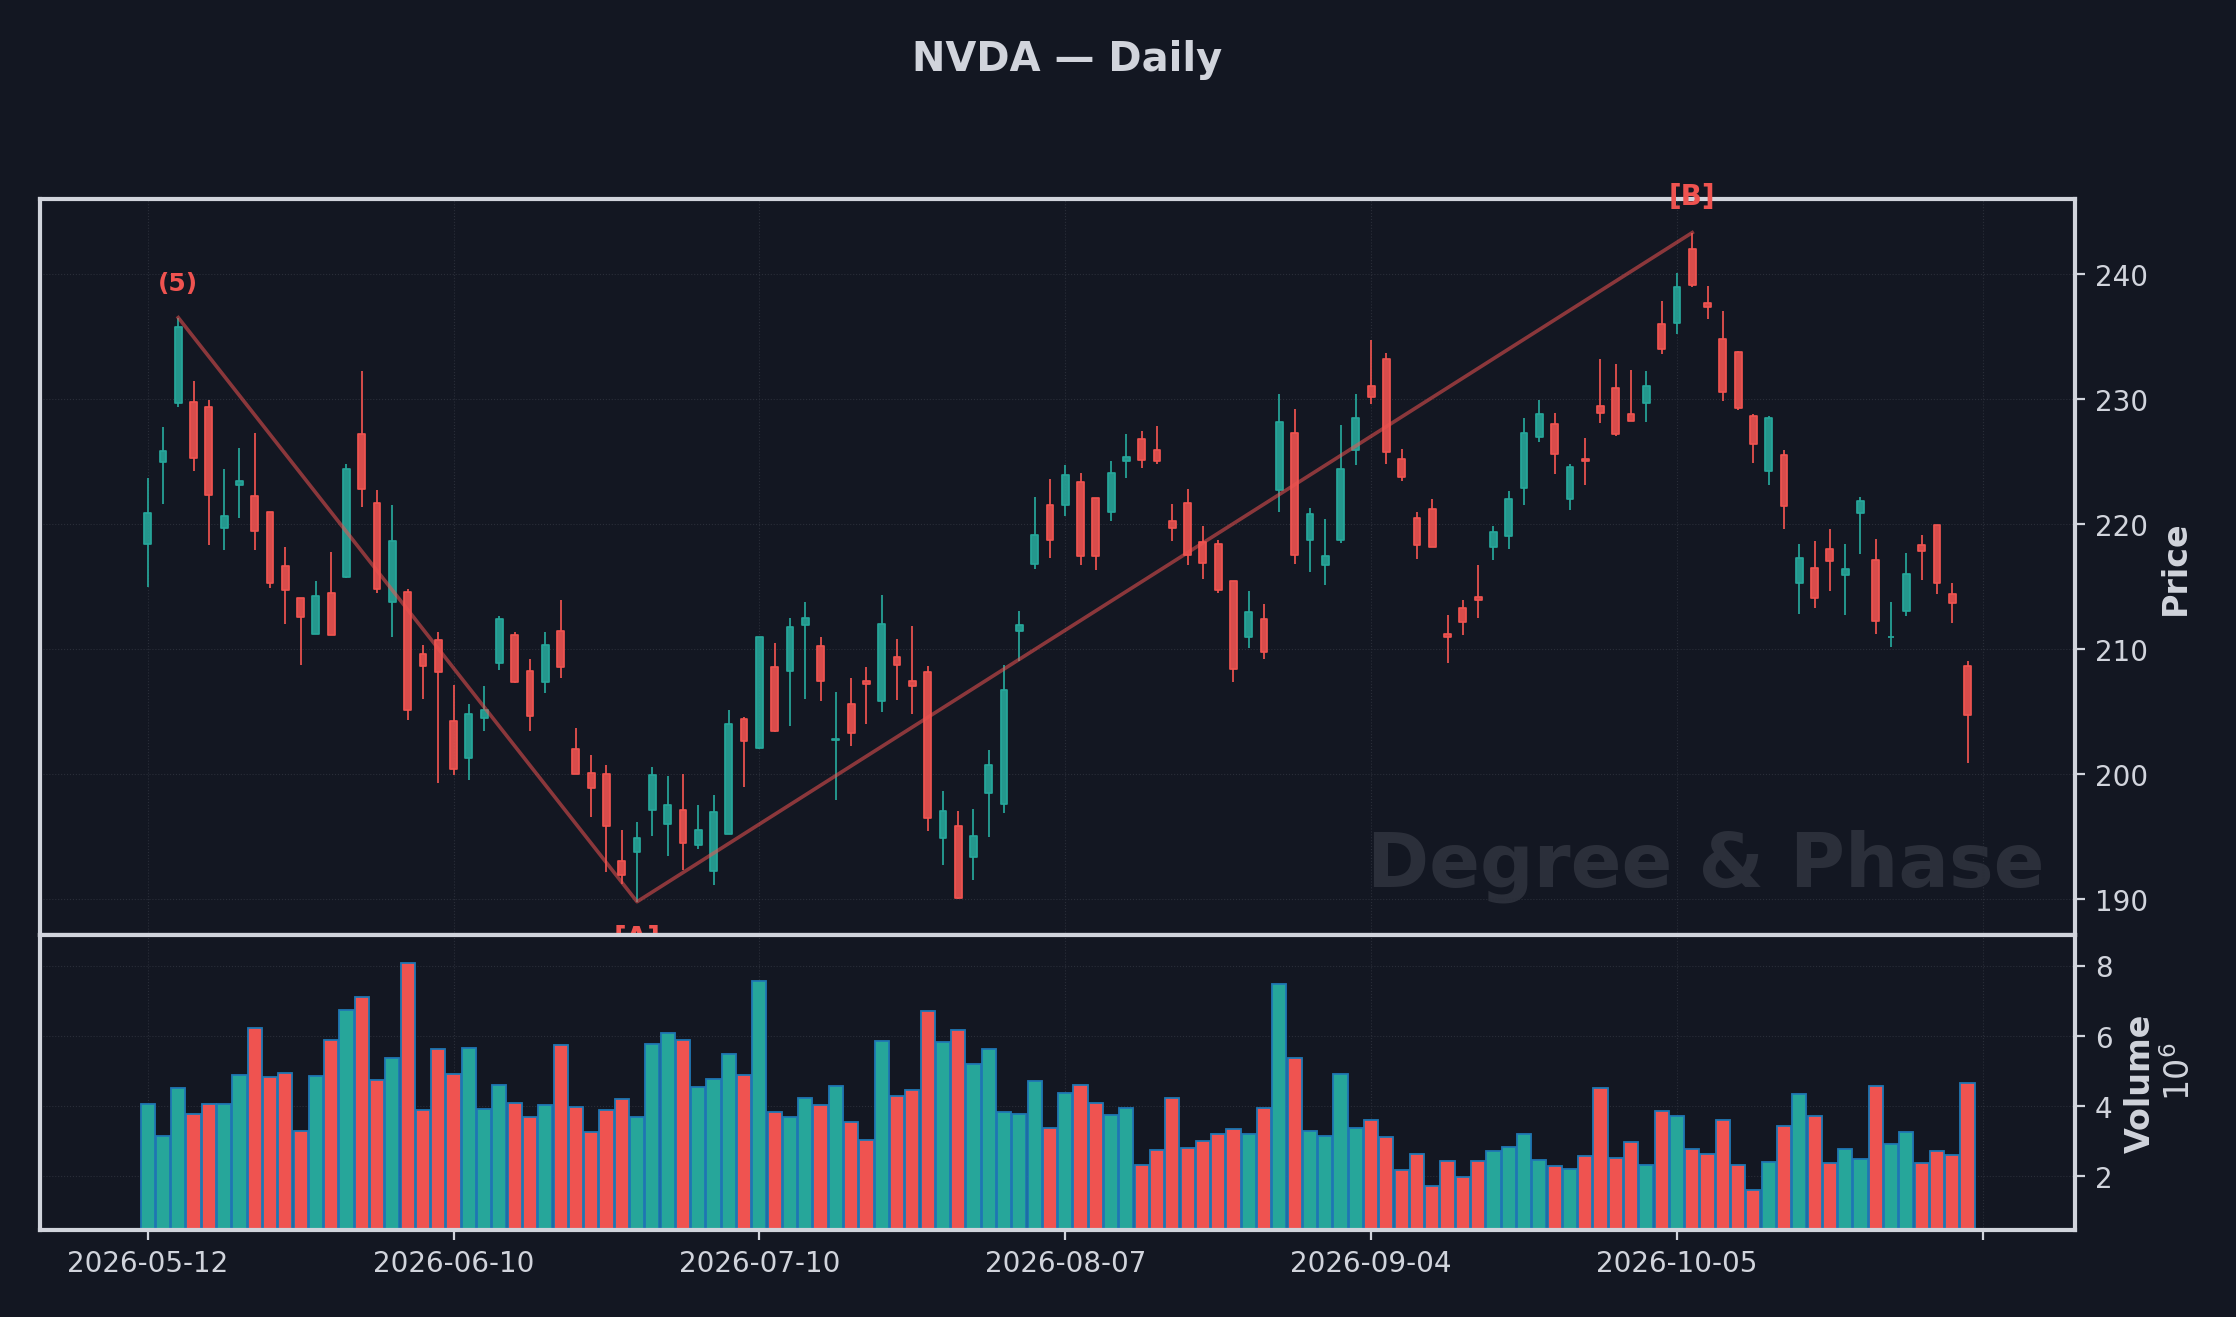
NVDA reads bearish. The advance off the prior low has topped and the structure has already delivered a first leg down, with the bounce failing beneath 210.06 and the next leg breaking the shelf on the heaviest volume of the window. The path of least resistance now runs toward 200.92 and 196.60, with 189.80 and 183.89 in play if sellers keep pressing through 203.20. A close back above 243.34 ends the argument; until then, bounces that stall under the resistance band are the shape to expect. The compass is the invalidation, not the noise around it.
TSLA setup Oct 30
Chart · Oct 30 daily →
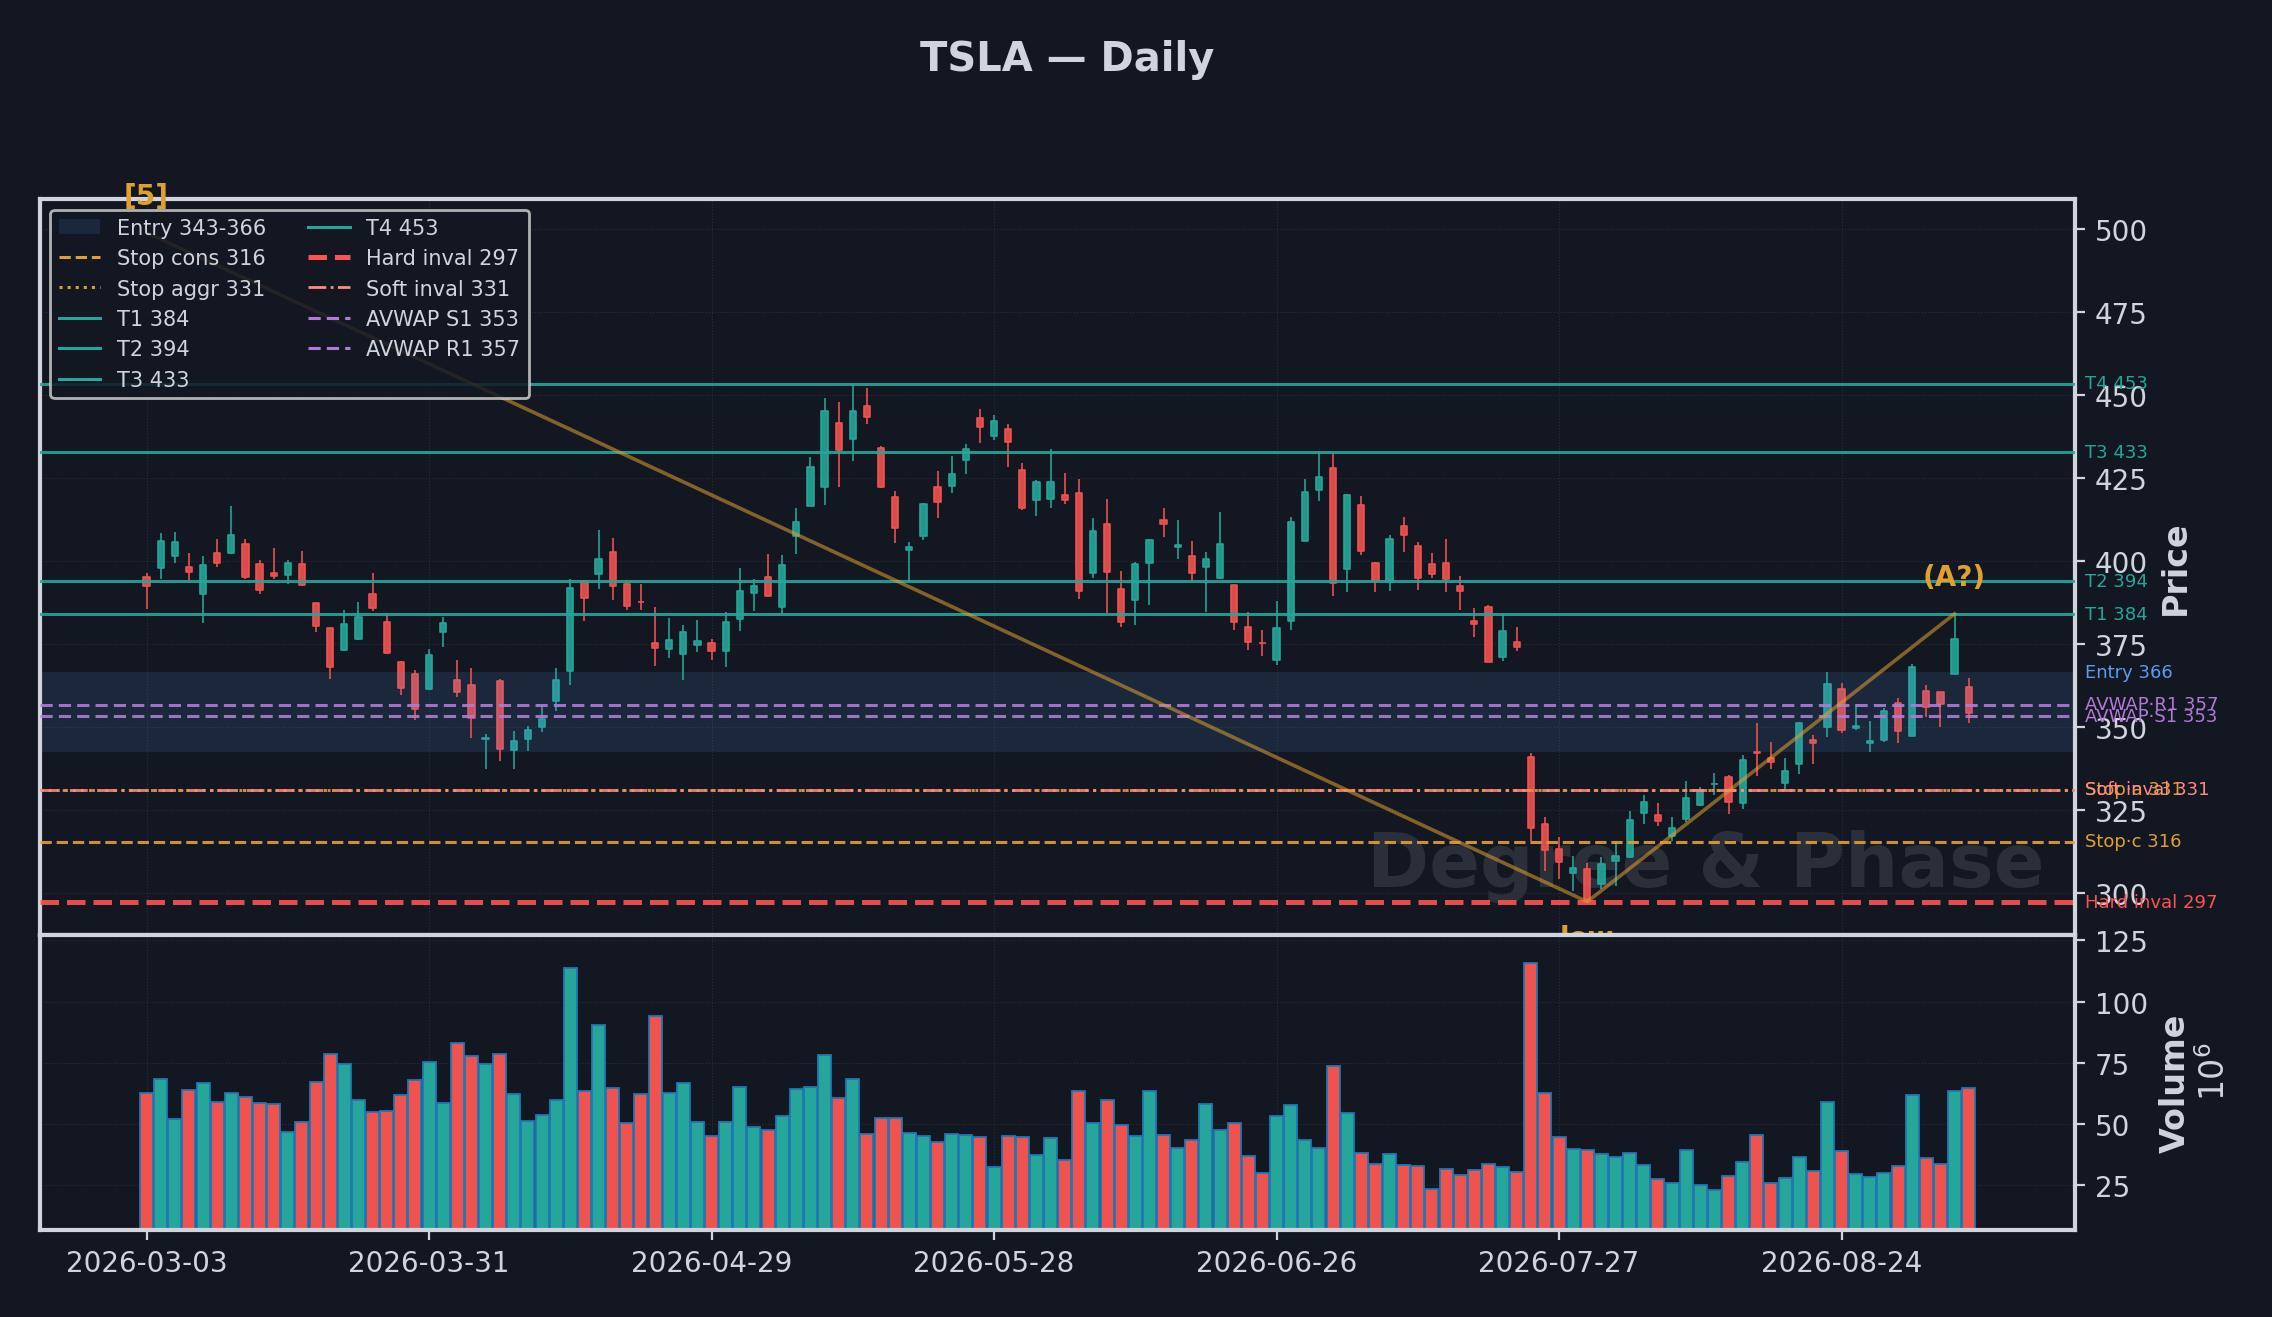
TSLA reads bullish while the recovery off the recent low keeps closing through supply. The climb has already taken out the levels that mattered, and the structure now reaches for 410.85 as the gate that extends the leg toward 420.01, then 432.85, and deeper to 453.40. 396.03 is the floor the advance has to defend to keep that path open, with 400.75 the near resistance the tape has to resolve through. 297.38 is the level that ends the argument on a sustained close below; above it, the leg is still owed.
SPCX setup Oct 30
Chart · Oct 30 daily →
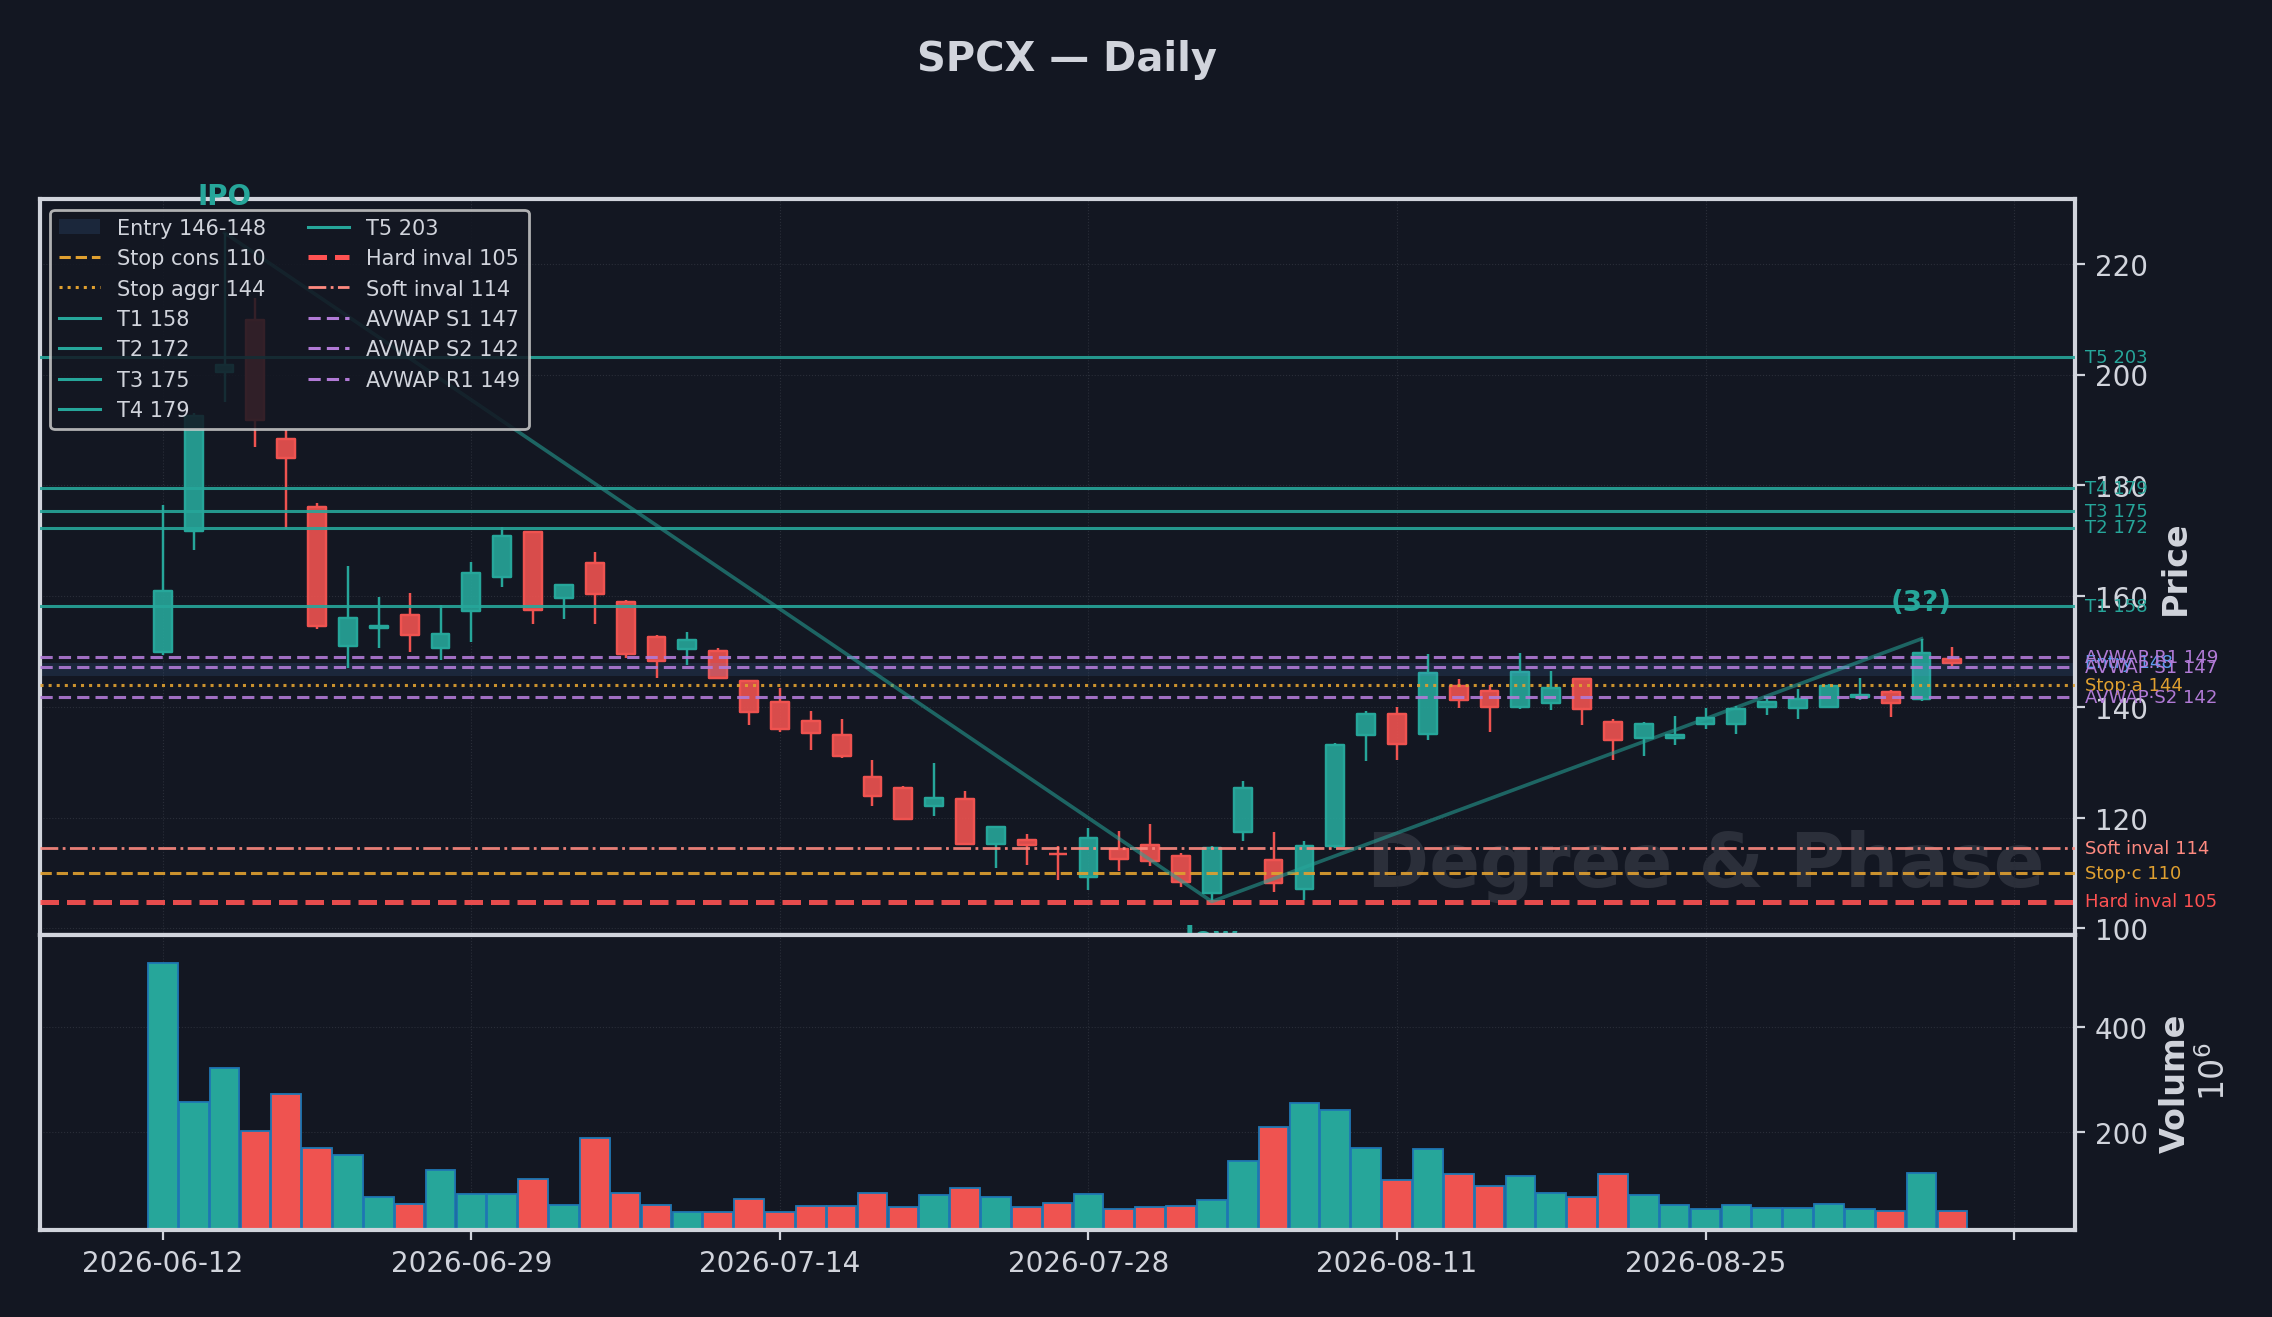
SPCX reads bearish. The recovery traded as a countertrend bounce and the structure has rolled, with the recent high failing against 142.19 and price closing on its lows. The path of least resistance runs toward 132.18, then opens 130.40, with room beneath to 120.16 and ultimately 104.85 if supply keeps pressing. The level that ends the argument is 176.39; a sustained reclaim there retires the short read and nothing above it needs defending. Until then, bounces into resistance are rallies to fade, not lows to buy.
NQ setup Oct 30
NQ reads bearish. The top is in and the first leg down has given way to a corrective bounce that failed, with the next leg already breaking prior support and pressing lower through 28231.50. The path of least resistance runs toward 28054.00 and then 27699.25, with room to extend to 27495.00 and 26799.00 if supply keeps absorbing every rally into 28534.87. 28416.57 is the near-term shelf operators watch for a reflex, but the structural read owns the tape until 31513.00 takes it off the board. A close back above that level ends the argument. Until then, bounces are to be sold, not bought.
QQQ setup Oct 30
Chart · Oct 30 daily →
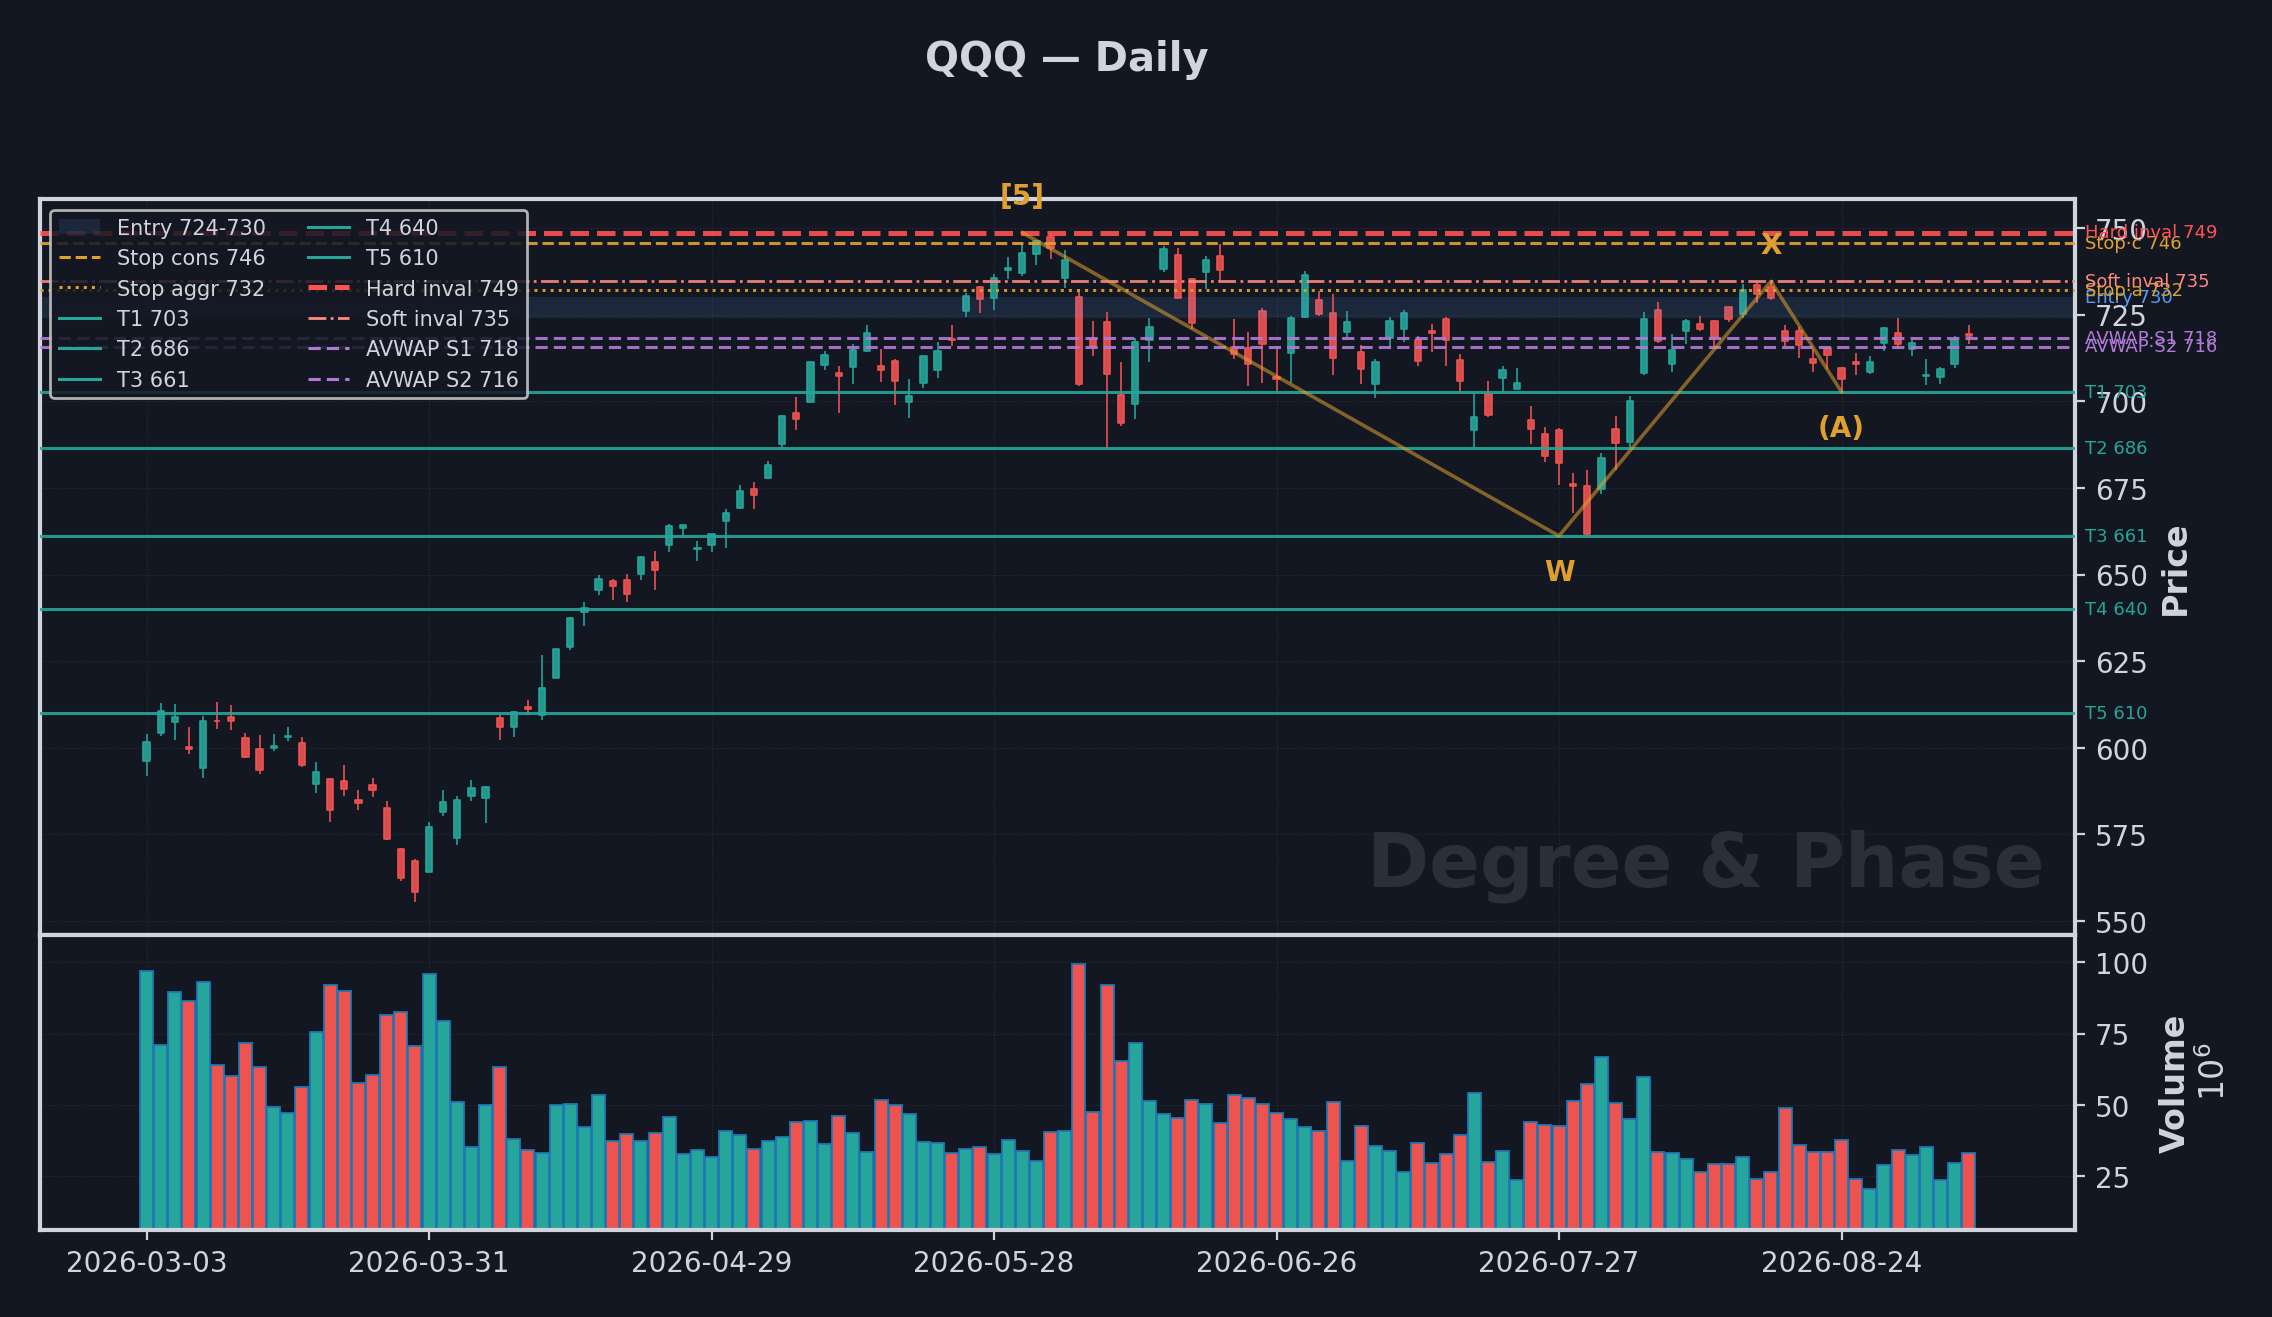
QQQ reads bearish. The top is in and the first leg down has given way to a failed bounce, with the next leg already breaking the prior shelf and pressing toward the next support band. The path of least resistance runs through 683.40 toward 679.13, then 670.54, with room beneath to 661.18 and 648.75 if sellers keep the tape. 690.84 caps the rallies that matter, and a reclaim of 690.20 on strength would force a rethink. 762.83 is the line that ends the argument on a sustained close through.
Why the numbers aren't arbitrary.
Every level on a setup card traces back to something. The entry sits where a wave completes or an anchored VWAP lines up. The stop sits at the price that would invalidate the count: cross it and the thesis is objectively dead, so you're out, no debate. The targets are the measured moves and Fibonacci projections the structure implies, scaled T1 through T5 so you bank profit on the way instead of hoping for the home run.
The conviction dots are the honest part. Three tools agreeing (Elliott, Wyckoff, and AVWAP all pointing the same way) earns a high number. One tool leading and the others neutral earns a low one. A low-conviction setup isn't a bad trade; it's a small one. That distinction is the whole game.
Live context.
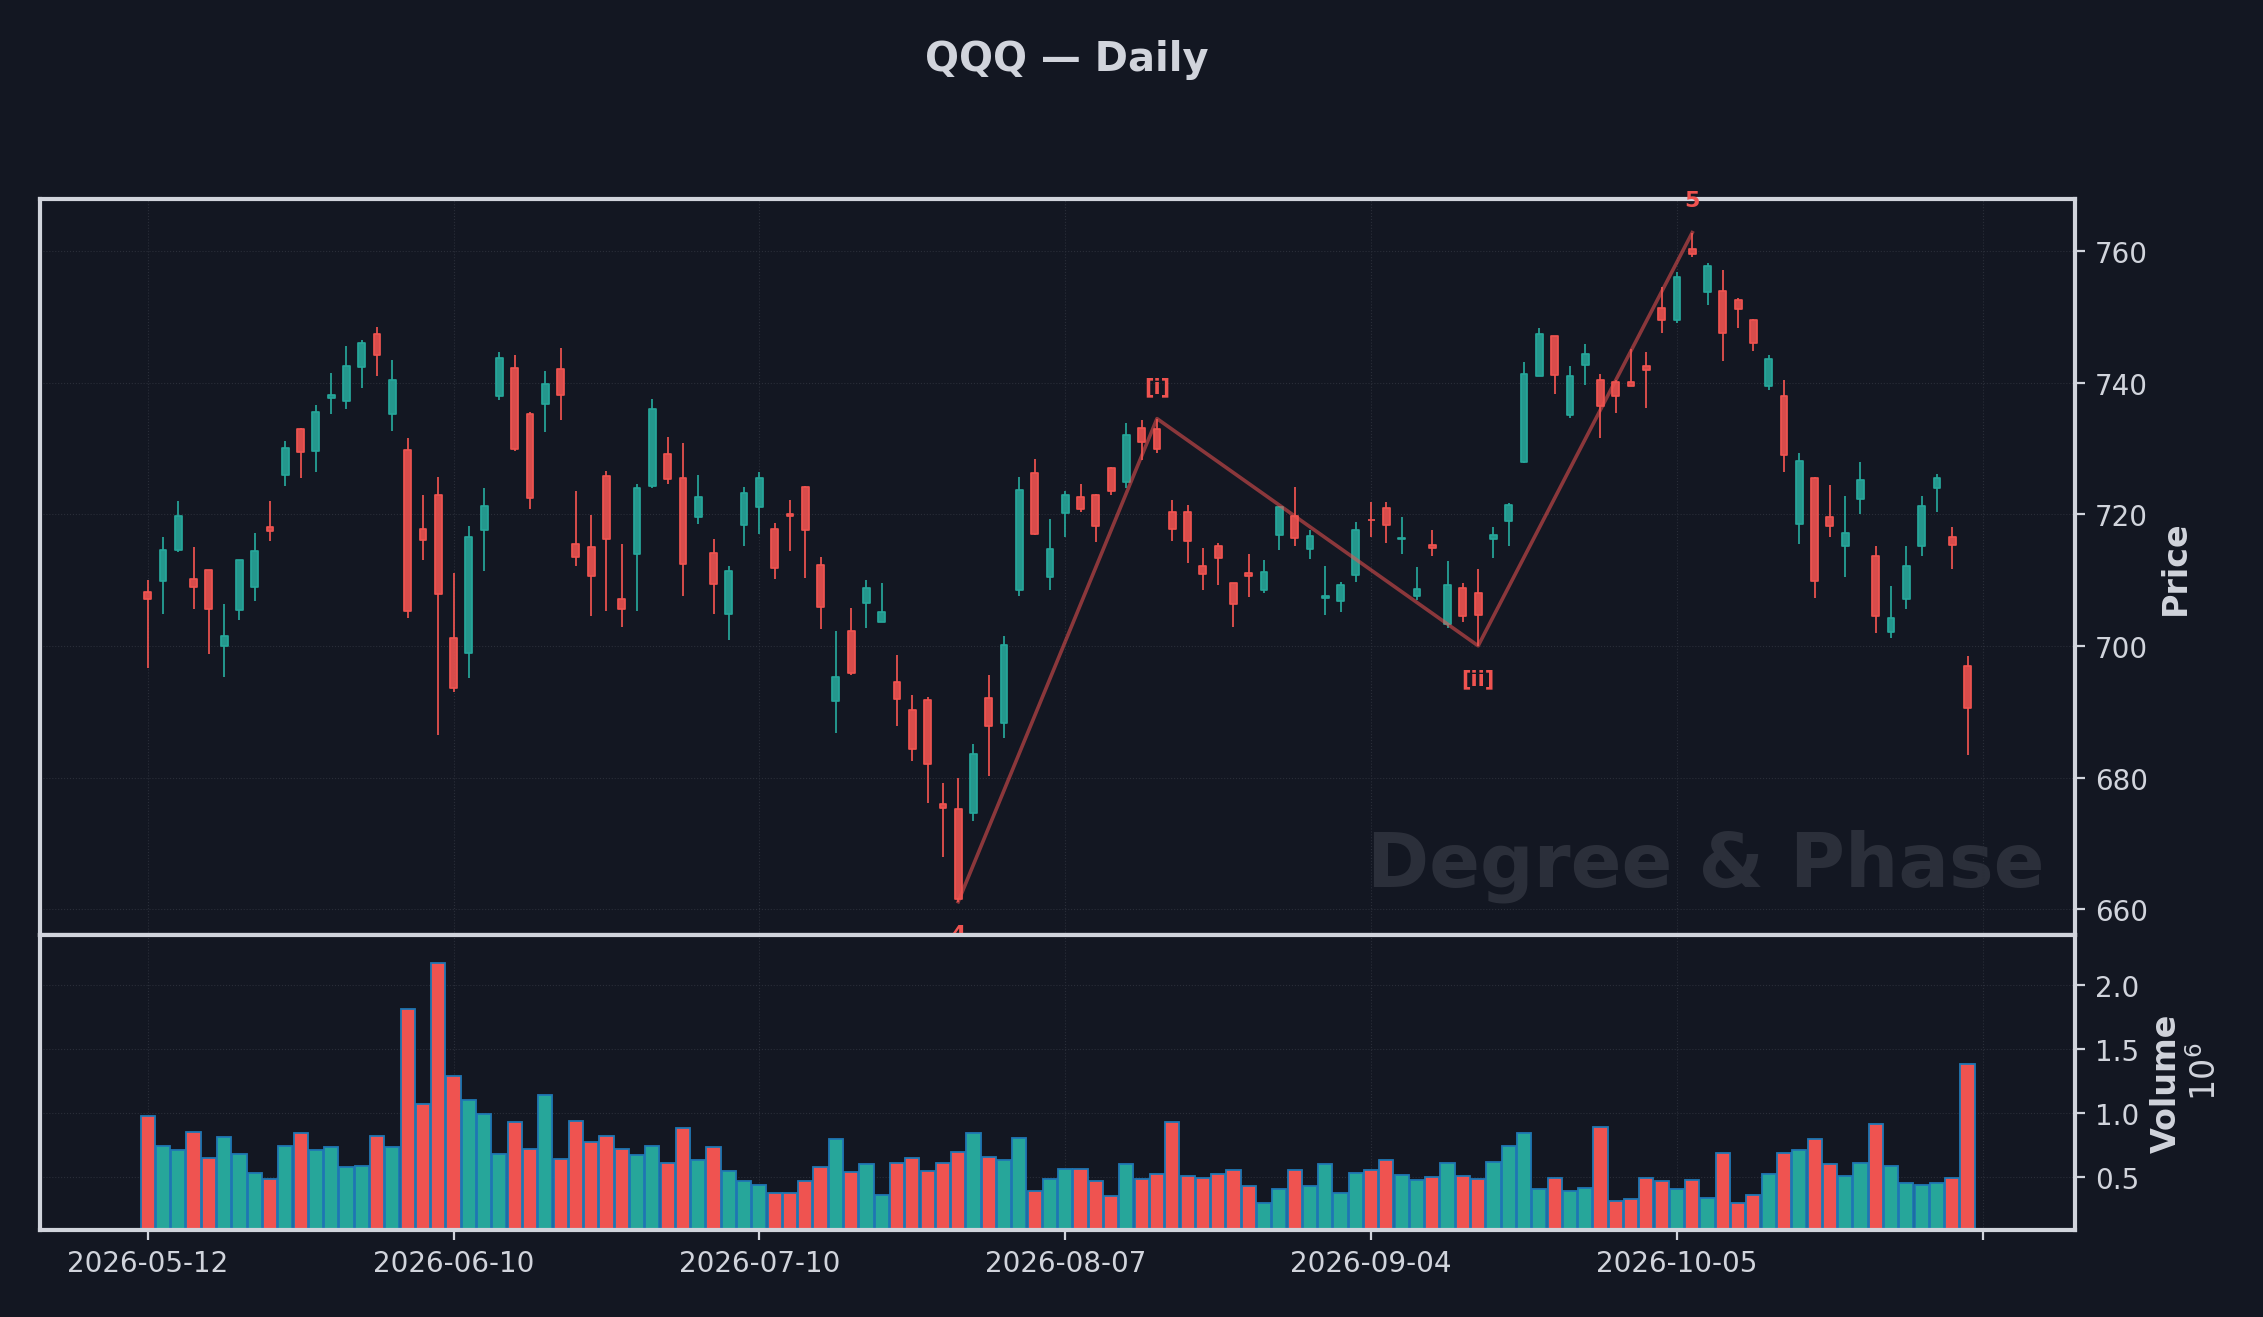
The primary structure is worked on QQQ (clean license); the Mag 7 names are the cross-validation. Below: our produced, wave-annotated QQQ daily chart, plus a quick read on two of the leaders. NQ futures carry the structural work referenced in the cards above.
Setups are for members.
The full setups (Mag 7, SPCX, QQQ, and NQ, with live levels and conviction) move behind membership as the site grows. Membership runs about $100 a month when it opens. Join the free list now and lock in a founding rate far below that.
Start free with the weekly Nasdaq read. When membership opens at about $100 a month, early readers stay locked far lower, for good.